
Ben Collier, PhD Book a call →free, 15 minutes

Tepper · MS in Business Analytics

Introduction to Probability and Statistics

Probability and inference taught twice over, in Excel and in Python, through business decisions.

The first quantitative course in the full-time MS in Business Analytics: probability, distributions, sampling, estimation, hypothesis tests, and regression.

  • Fall 2024, Mini 1
  • Mondays and Wednesdays, two morning sections
  • Course number 46-880
Slide: How likely is it that two people in today's class share a birthday?
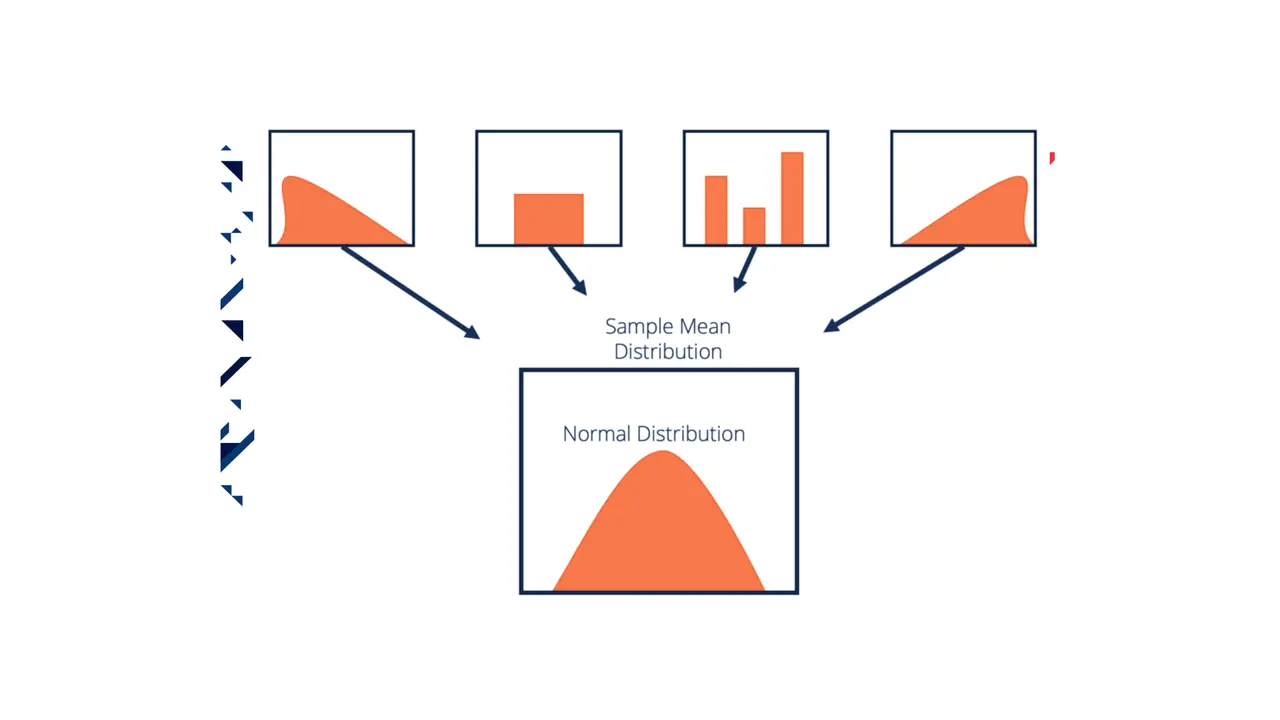
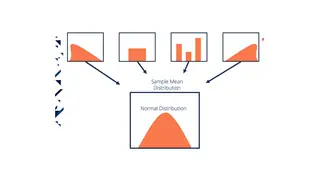
Slide: Whatever shape the population takes, the sample mean ends up normal
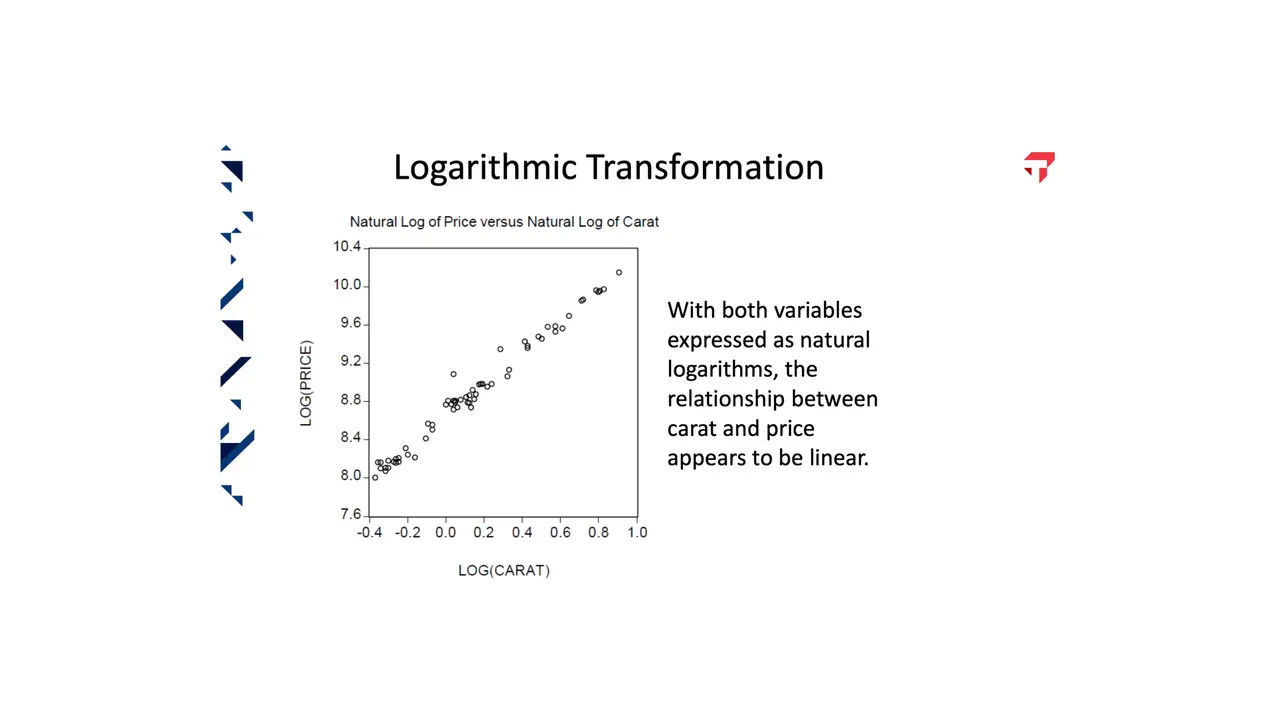
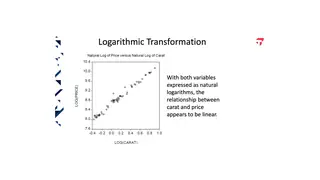
Slide: Take logs of price and carat and the diamond data falls on a line

slides from the decks
I taught from

Fall 2024, Mini 1 · Mondays and Wednesdays, two morning sections

Week by week

Scroll the schedule and the slides follow along: five from each session, picked from the decks I taught from.

  1. Part I: Probability
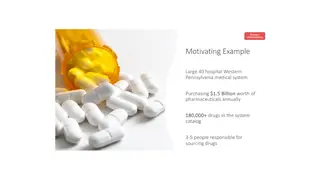
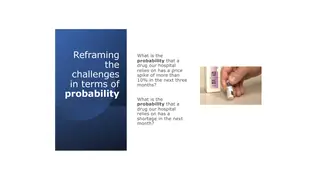
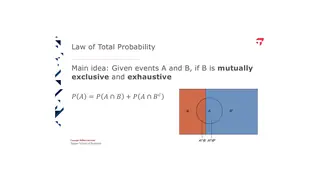
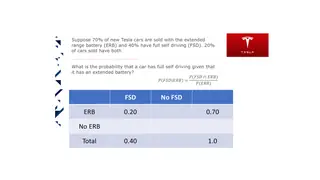
  2. M1Introduction to ProbabilityChapter 4How likely is it that two people in today's class share a birthday?A 40-hospital system buying $1.5 billion of drugs a year with three to five buyersReframing the hospital's drug price and shortage worries as probability questionsLaw of total probability: split A across B and not-BTesla batteries and self-driving: a conditional probability from a joint table
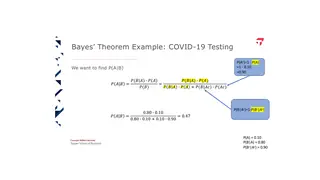
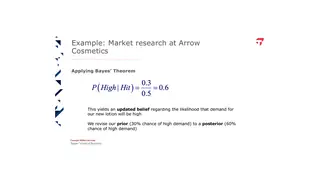
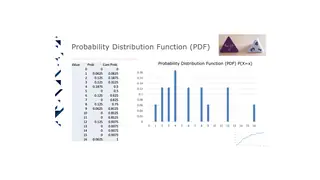
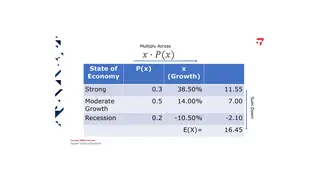
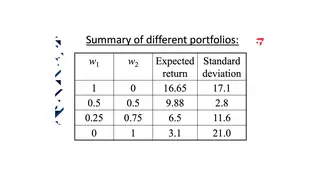
  3. M1Bayes' Theorem and Discrete Random VariablesChapter 5Bayes' theorem on a COVID-19 test: a positive result means only a 47% chance of infectionArrow Cosmetics: a good market test moves the chance of high demand from 30% to 60%The product of two four-sided dice, as a table and as a bar chartExpected growth of Microsoft stock: multiply across, sum downMixing two stocks: how portfolio weights trade expected return against risk
  4. M2No class: Labor DayNo class
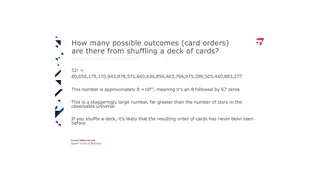
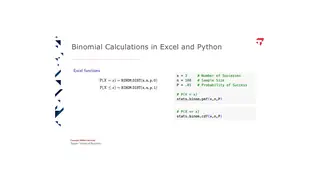
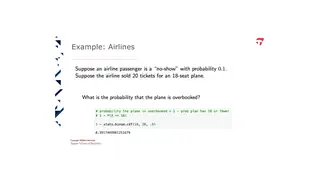
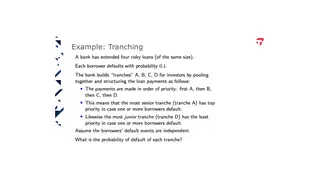
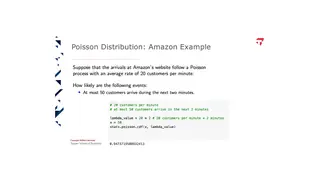
  5. M2Discrete Probability DistributionsBinomial, geometric, and Poisson. Chapter 552 factorial: a shuffled deck is almost certainly in an order no one has seenEvery binomial question twice: BINOM.DIST in Excel, stats.binom in PythonSell 20 tickets for 18 seats: what is the chance the plane is overbooked?Tranching four risky loans: who gets paid first when borrowers defaultPoisson arrivals at Amazon: at most 50 customers in two minutes
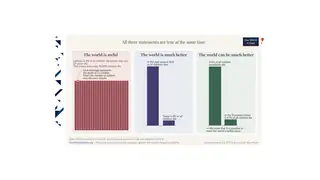
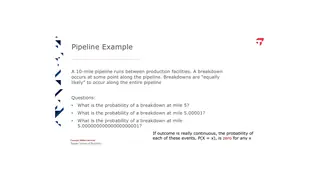
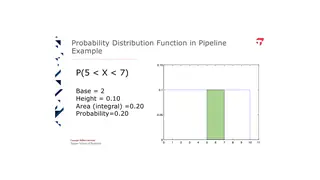
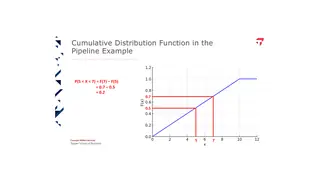
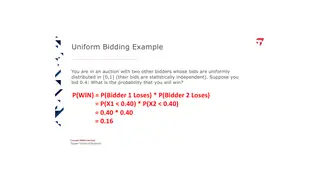
  6. M3Continuous Random VariablesChapter 6The world is awful, much better, and can be much better, all at onceA breakdown on a 10-mile pipeline: why any single point has probability zeroFor a continuous variable, probability is area under the curveReading the same answer off the cumulative distribution functionBid 0.4 against two uniform bidders and you win 16% of the time
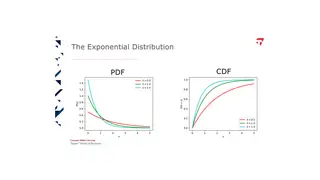
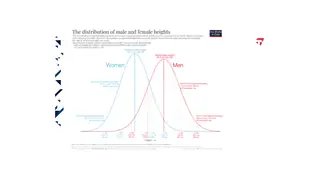
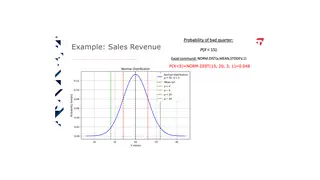
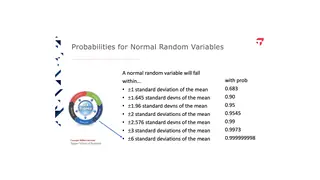
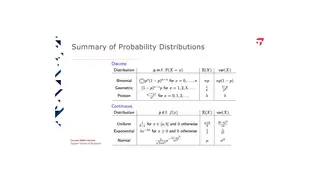
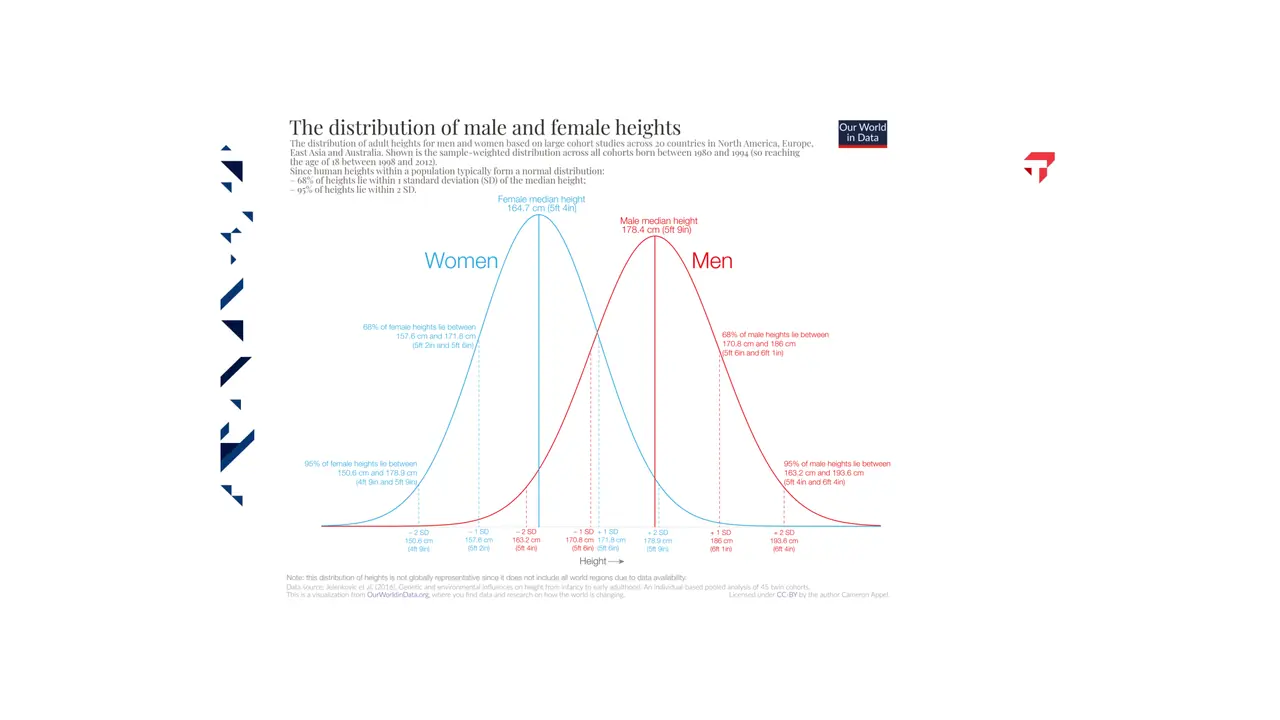
  7. M3Continuous Probability DistributionsUniform, exponential, and normal. Chapter 6The exponential distribution: time until the next arrival, at three ratesAdult heights for women and men: two overlapping normal curvesQuarterly revenue as a normal variable: the chance of a bad quarterFrom one standard deviation to six: where Six Sigma gets its nameEvery distribution in the course on one page, with its mean and variance
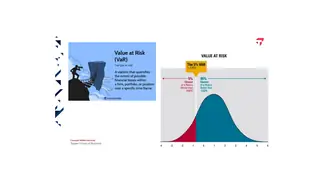
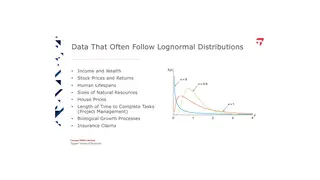
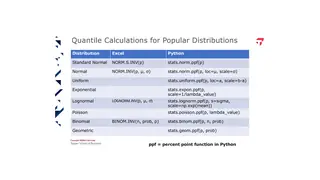
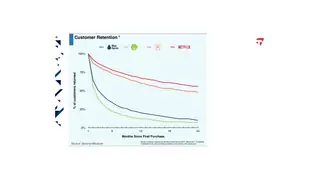
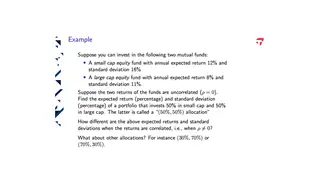
  8. M4Normal Distribution and Joint DistributionsIncludes the lognormal. Chapters 5 and 6Value at risk: the loss you beat 95% of the timeIncome, stock prices, house prices, insurance claims: data with a lognormal shapeQuantiles for every distribution, in Excel and in PythonCustomer retention curves for Netflix, Blue Apron, and othersSmall cap or large cap: how correlation changes the risk of a 50/50 portfolio
  9. Part II: Statistical Inference
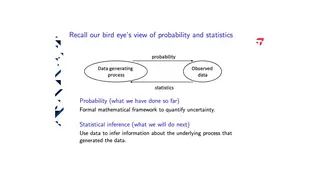
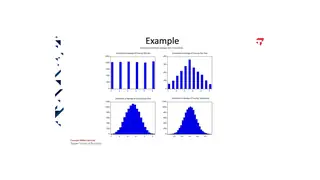
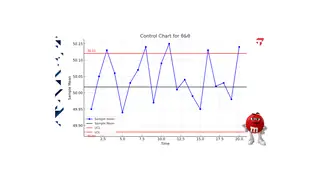
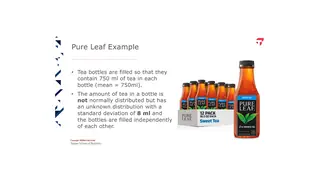
  10. M4Central Limit Theorem and SamplingChapter 7Probability runs from process to data; statistics runs back the other wayAverage more dice and the distribution of the mean turns normalWhatever shape the population takes, the sample mean ends up normalA control chart for a candy-filling machine: sample means against control limitsPure Leaf bottles should hold 750 ml. How far can a sample mean drift?
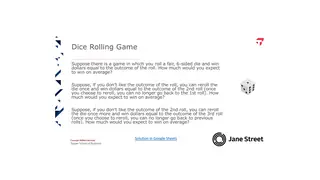
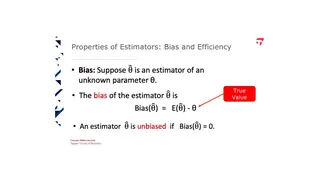
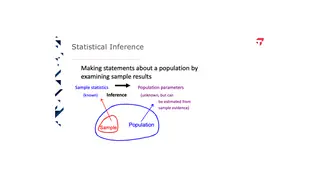
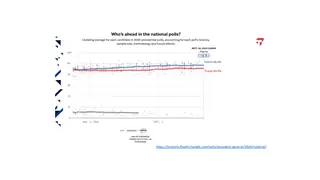
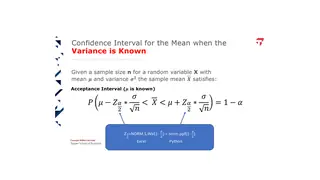
  11. M5Interval EstimationChapter 8A Jane Street interview puzzle: what is the right to reroll a die worth?Bias: how far an estimator's average lands from the true valueInference: from a sample we can see to a population we cannotThe 2024 national polling average, with its band of uncertaintyA confidence interval for the mean, with the z value in Excel and Python
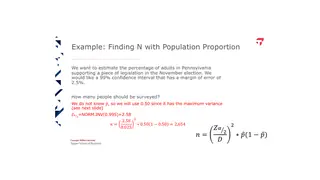
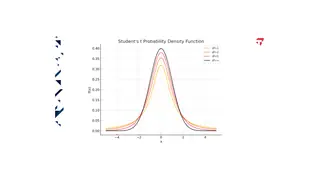
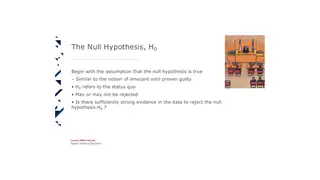
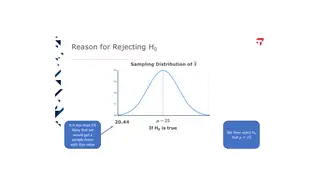
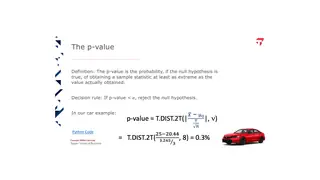
  12. M5Hypothesis TestingChapter 9How many Pennsylvanians to poll for a 2.5% margin of error: 2,654The t distribution: fatter tails with fewer degrees of freedomThe null hypothesis works like innocent until proven guiltyA sample mean of 20.44 mpg is too unlikely if the true mean is 25The p-value for the car mileage claim in one Excel formula: 0.3%
  13. Part III: Regression
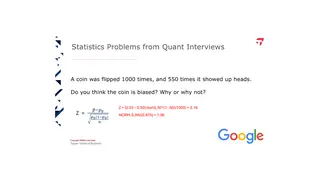
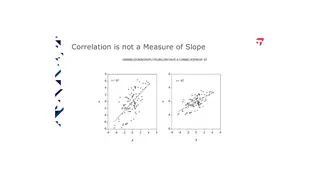
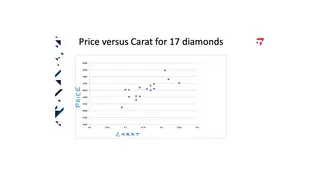
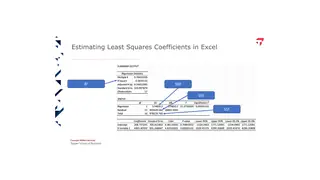
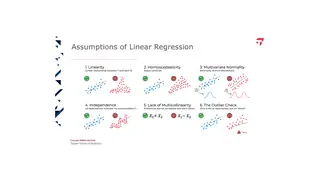
  14. M6Regression AnalysisChapter 14A quant interview question: is a coin that lands heads 550 times in 1,000 biased?Same correlation, different slopes: r = 0.67 in both plotsPrice against carat for 17 diamonds, the running regression exampleReading Excel's regression output: R squared and the sums of squaresSix assumptions of linear regression, each with a pass and a fail
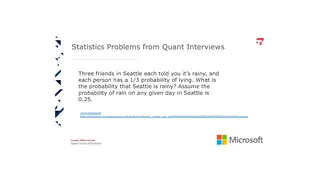
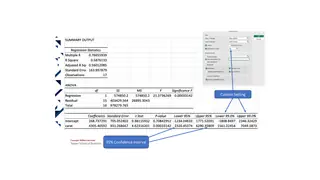
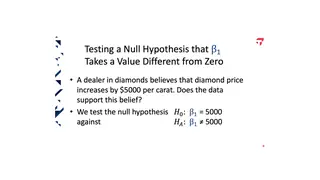
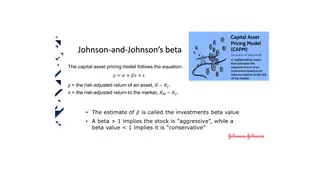
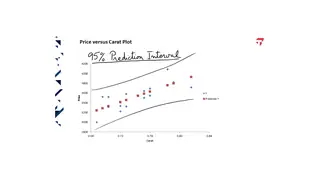
  15. M6Inference with RegressionChapter 15Three friends in Seattle say it's raining, and each lies a third of the timeWhere the confidence interval for the slope sits in Excel's regression outputA diamond dealer claims $5,000 per carat. Does the data back that up?Estimating Johnson and Johnson's beta with the capital asset pricing modelThe 95% prediction interval widens away from the center of the data
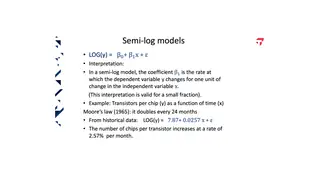
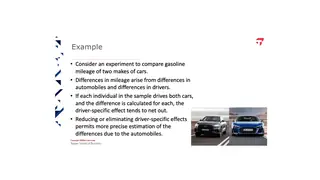
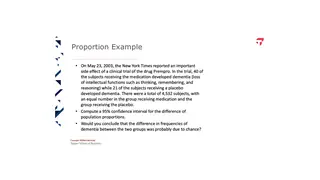
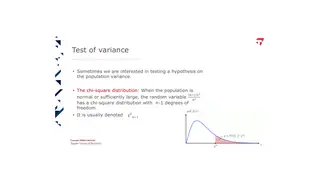
  16. M7Advanced Hypothesis Testing and RegressionLog transformations, two-sample tests, and tests of variance. Chapters 10 and 14Take logs of price and carat and the diamond data falls on a lineMoore's law as a semi-log regression: transistors grow about 2.6% a monthHave the same drivers test both cars and the driver effect cancels outThe Prempro trial: was the gap in dementia cases more than chance?The chi-square distribution, for testing a claim about variance
  17. M7Review SessionIn-class exercisePractice problems worked in class before the final
  18. M7Final ExamIn-class exerciseOpen book, on Canvas

Method

How the course works

Every distribution is taught twice, once with its Excel formula and once with its Python call, and nearly every example is a business decision: overbooking a flight, a cosmetics launch whose chance of success moves from 30% to 60% after a market test, tea bottles that must hold 750 ml. Sessions open with a puzzle or a question from quant interviews.

Halfway through the seven-week term I changed the pace: more worked examples in class, practice sets with solutions, a short written summary of each module, and walkthrough videos for the hardest problems.

Adult heights for women and men: two overlapping normal curves
fig. 1 · Adult heights for women and men: two overlapping normal curves

What students hand in

Major assignments

  • Problem sets40%
  • Final exam60%
  • Extra credit, up to20%
  • Extra credit, up to9%
fig. 2 · weight of each major assignment in the grade

Problem sets 40%

Six weekly sets of business problems, solved in Excel or Python and submitted on Canvas. Students could work through them with their assigned MSBA group but submitted individually. The problems include who wins a seven-game World Series, how long it takes to roll doubles to get out of jail in Monopoly, how many ambulances a service needs when calls arrive every 75 minutes on average, value at risk for a portfolio, lognormal insurance claims, and whether coffee and soda prices move together.

Final exam 60%

An open-book, open-notes exam taken on Canvas in the final exam period, with questions modeled on the problem sets, quizzes, and class examples.

Extra credit, up to 20% one extra credit, up to

In-class quizzes

Fifteen to twenty one-point quizzes taken on laptops during class, using the ideas covered that day.

Extra credit, up to 9% two extra credit, up to

Section quizzes

Three optional Canvas quizzes, each covering the previous two weeks of material.

Practice sets, summaries, and walkthrough videos

Added halfway through the term: practice problem sets with solutions for interval estimation, hypothesis testing, and regression, a written summary of each module and a combined formula sheet, and recorded walkthroughs of the harder problems, such as the airline overbooking expected value problem.

In their words

What students say

4.10 out of 5 average teaching rating · 2 sections · 120 student responses · all evaluations

He has listened to the midpoint feedback of students and adjusted the teaching style based from that.

Fall 2024

He shows respect and care to every single student, and he uses real interview questions as brain teasers at the beginning of every class.

Fall 2024

He takes the time after class to answer everyone's doubts, not only limited to course but also extended to professional development.

Fall 2024

Revision history

How the course developed

I taught the MS in Business Analytics program's first-term statistics course in Fall 2024, in two morning sections. I reworked the slide decks I inherited and used Excel and Python alongside the textbook, so that every idea had both a formula and a working example.

Offerings

  • Fall 2024 full-time

Students received the problem sets and walkthrough videos on Canvas.

All courses