

Ben Collier, PhD Book a call →free, 15 minutes

Tepper · MS in Business Analytics

Machine Learning for Business Applications

Taking a model out of the notebook and into a working business system on AWS.

Applied machine learning for MS in Business Analytics students, built around a cloud pipeline on AWS.

  • Spring 2026, Mini 4
  • Mondays (lecture) and Wednesdays (lab)
  • Course number 46-887
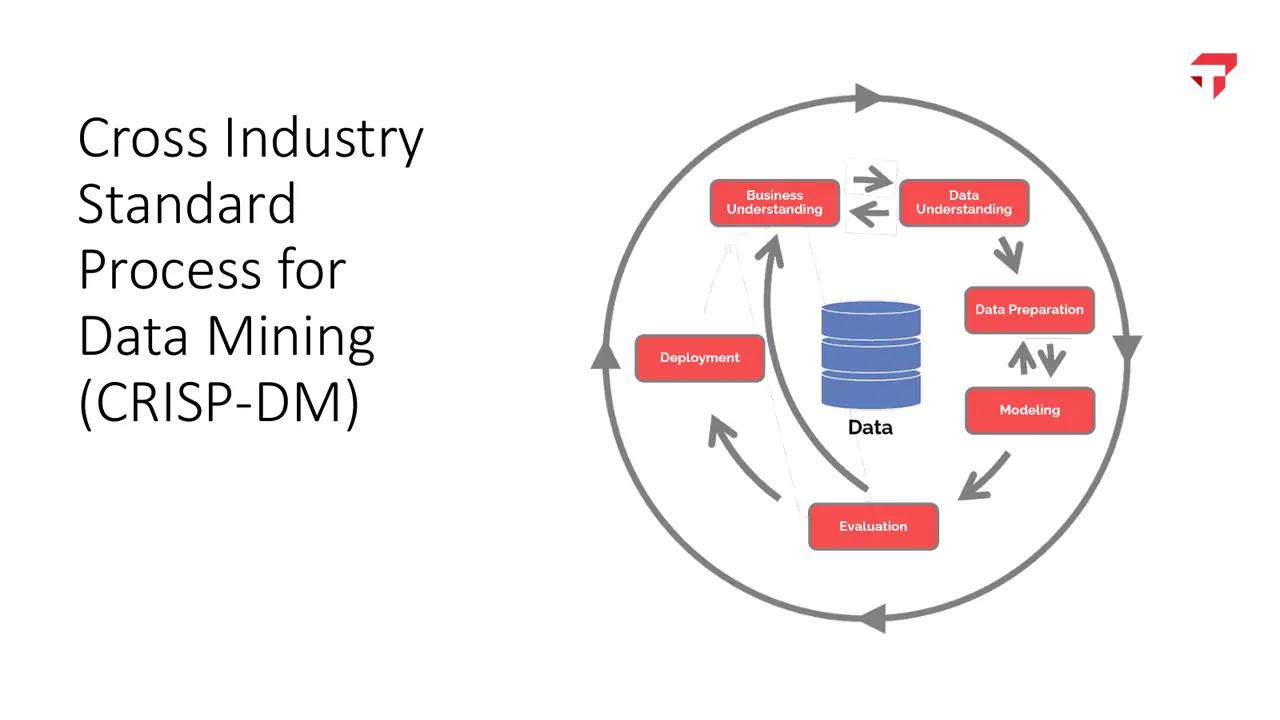
Slide: CRISP-DM: the loop every data mining project runs through
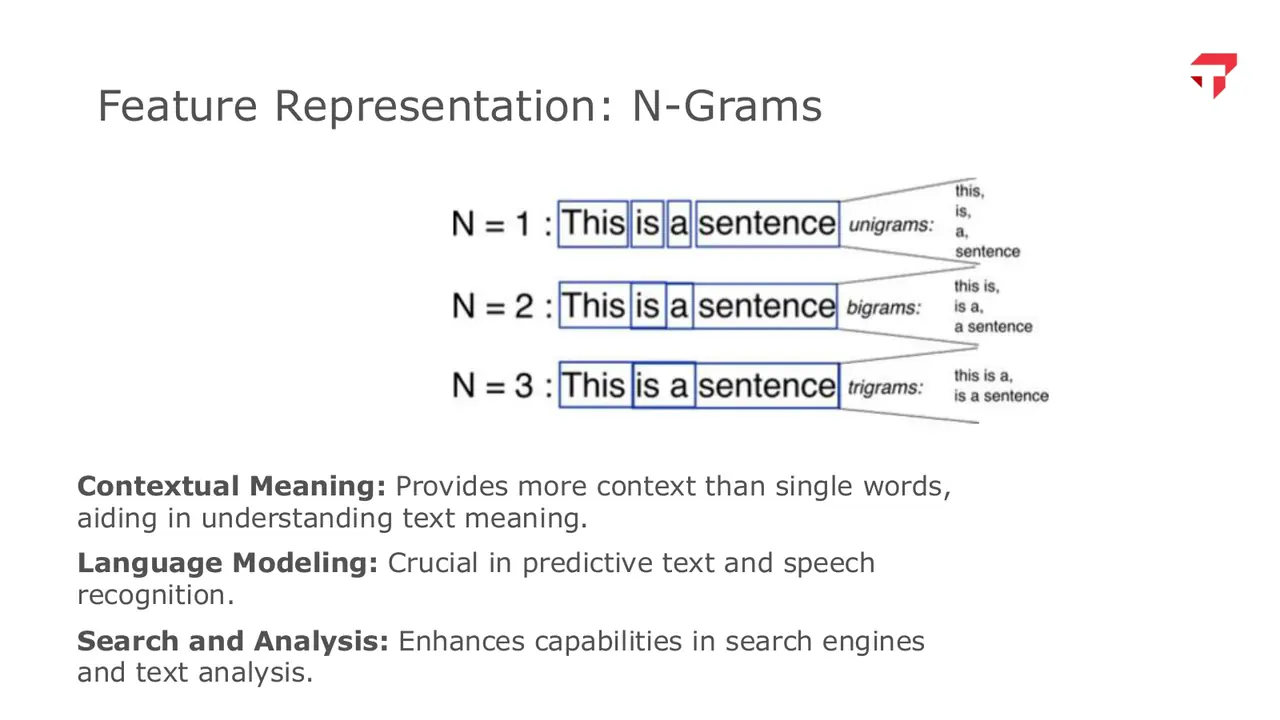
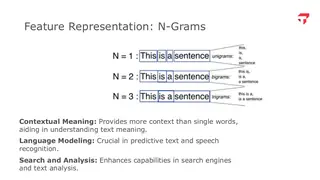
Slide: N-grams: one, two, and three words at a time
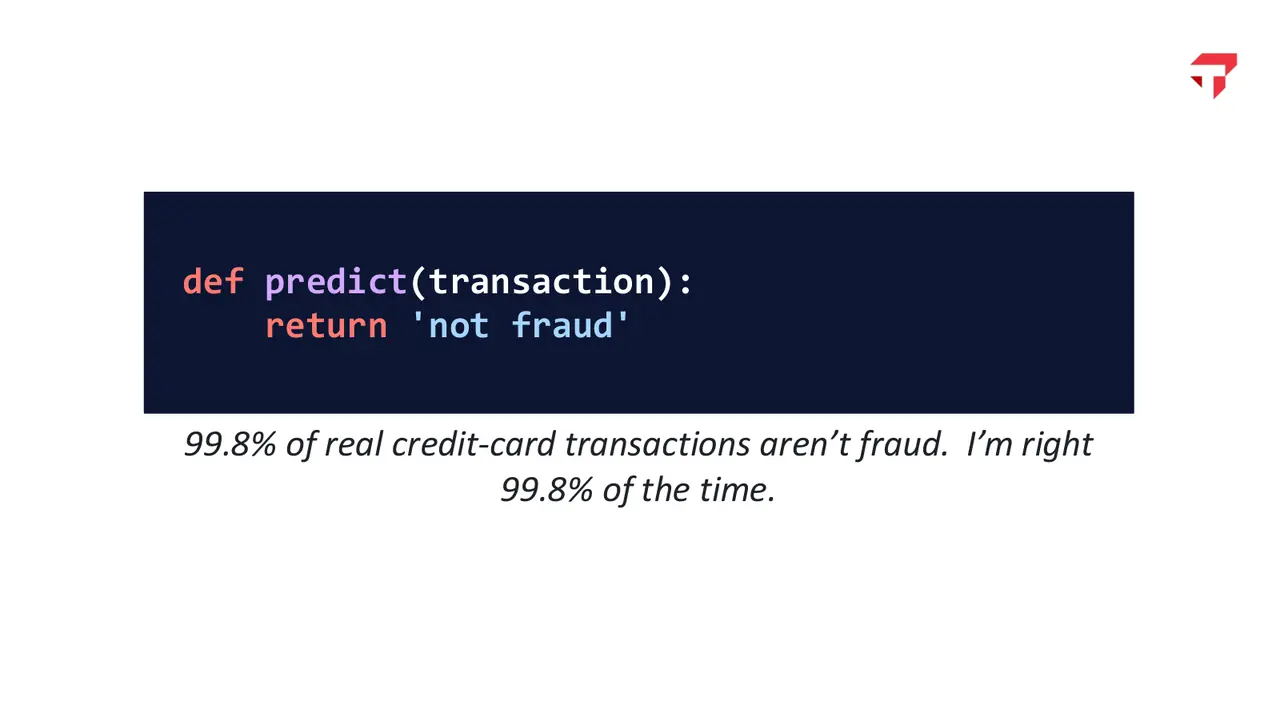
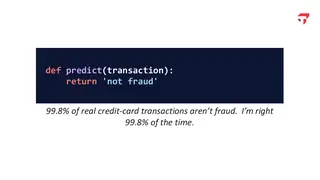
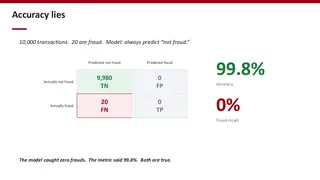
Slide: A one-line fraud detector that is right 99.8% of the time

slides from the decks
I taught from

Spring 2026, Mini 4 · Mondays (lecture) and Wednesdays (lab)

Week by week

Scroll the schedule and the slides follow along: five from each session, picked from the decks I taught from.

  1. Part I: From models to systems
  2. W1No class: spring breakNo class
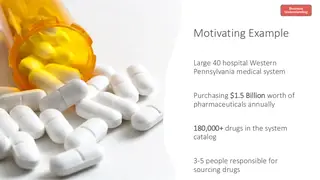
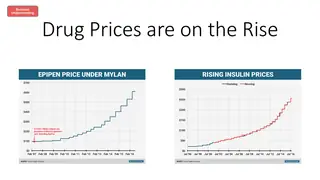
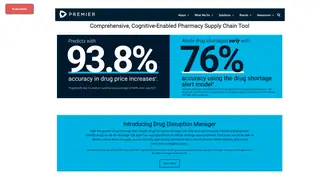
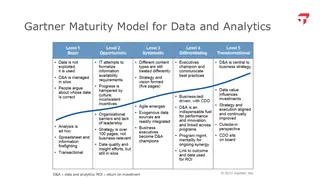
  3. W1Course Introduction: From ML Models to AI SystemsCRISP-DM: the loop every data mining project runs throughMotivating example: a 40-hospital system buying $1.5 billion of drugs a year with three to five buyersEpiPen and insulin prices: the business problem behind the modelThe finished tool: 93.8% accuracy on price increases, 76% on shortage alertsGartner's five levels of data and analytics maturity
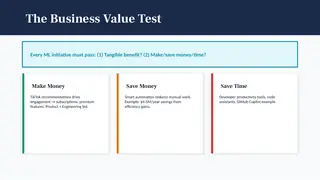
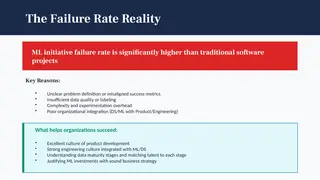
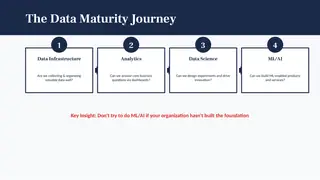
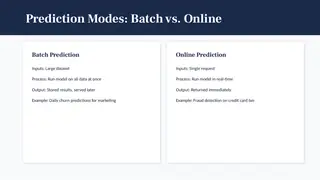
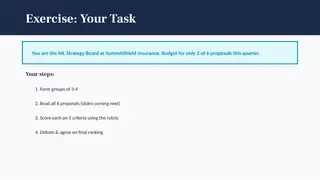
  4. W2Integrating ML Models into Business ServicesGroup exercise: ML Project TriageThe business value test: make money, save money, or save timeWhy ML initiatives fail more often than ordinary software projectsThe data maturity journey: don't try ML before the foundation is builtBatch versus online predictionML Project Triage: an insurer's strategy board can fund two of six proposals
  5. W2Lab: AWS Cloud Setup and ML Pipeline ComponentsIn-class exerciseS3, Lambda, SageMaker, and a MySQL database on RDS
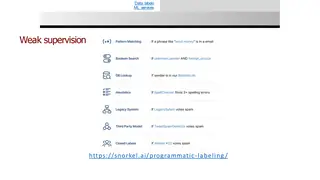
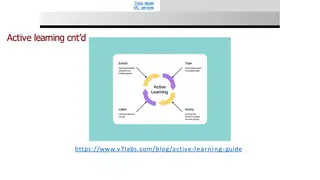
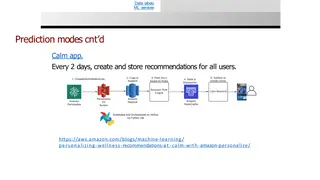
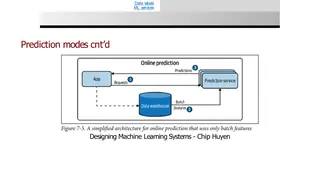
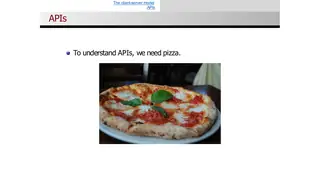
  6. W3Evaluation, Performance, and Testing ML SystemsWeak supervision: labeling spam with rules, lookups, and other models' votesActive learning: label only the examples the model needs nextCalm's batch pipeline: fresh recommendations for every user every two daysOnline prediction: the app asks, the prediction service answersTo understand APIs, we need pizza
  7. W3Lab: Building a Cloud Data PipelineIn-class exerciseTrain a churn model, store it in S3, score new customers into RDS
  8. Part II: Methods for business problems
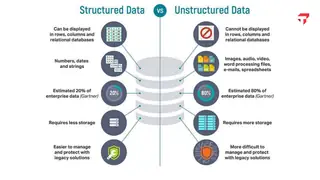
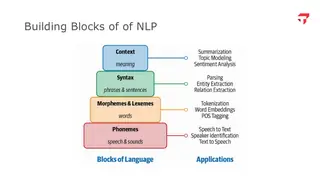
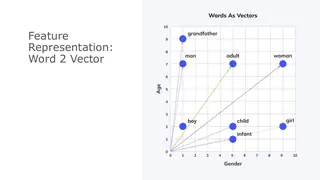
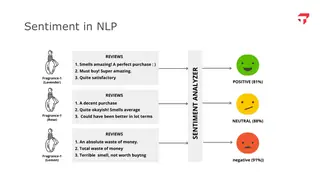
  9. W4Natural Language Processing and Large Language ModelsStructured versus unstructured data: about 80% of enterprise data is text, images, and audioThe building blocks of language, from sounds to meaningN-grams: one, two, and three words at a timeWords as vectors: age and gender as two dimensionsSentiment analysis turns product reviews into positive, neutral, and negative
  10. W4Lab: Natural Language Processing and Large Language ModelsIn-class exercise
  11. W4Midpoint project presentations (recorded on Zoom)Presentations
  12. W5Lab: Using an LLM for digital marketingIn-class exercise
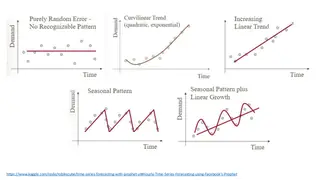
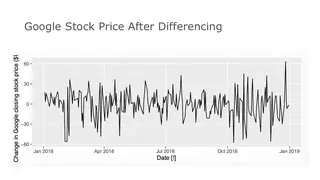
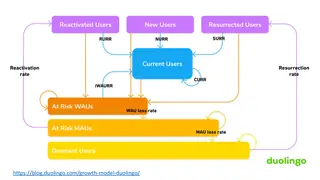
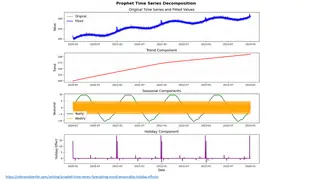
  13. W6Time Series Forecasting for BusinessU.S. retail sales: trend and seasonality in one lineFive shapes of demand: noise, curves, trends, and seasonsGoogle's stock price after differencing: the trend is goneDuolingo's growth model: forecasting users who are new, at risk, or coming backProphet splits a series into trend, yearly and weekly seasonality, and holidays
  14. W6Lab: Forecasting Pipeline and Cloud-Connected TableauIn-class exercise
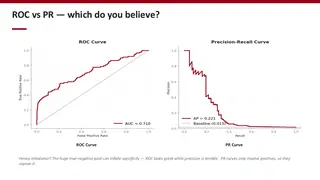
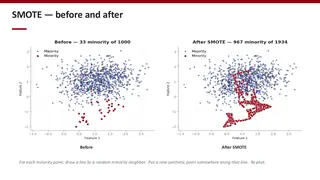
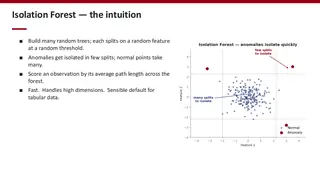
  15. W7Imbalanced Classification and Anomaly DetectionIn-class exercise: build a credit-card fraud detectorA one-line fraud detector that is right 99.8% of the timeAccuracy lies: 99.8% accurate, zero frauds caughtROC versus precision-recall: which curve do you believe?SMOTE before and after: synthetic points drawn between minority neighborsIsolation Forest: anomalies take only a few random splits to isolate
  16. W7Final Project PresentationsPresentations

Method

How the course works

The course takes models out of the notebook and into production. Students put data in S3, score it with Lambda and SageMaker, write predictions to a database they provision themselves on RDS, and read them live in Tableau or Streamlit.

Accuracy is the first number students learn to distrust. The fraud lab opens with a one-line model that never flags fraud and is still 99.8% accurate, then works through class weights, SMOTE, and isolation forests on a precision-recall leaderboard. In ML Project Triage, teams sit on an insurer's strategy board with money for two of six proposals, among them a drone moonshot with no data and a pricing engine that would be illegal in most states.

The team project is a working proof of concept: a model, a cloud database of its predictions, and a dashboard, shown in a live demo.

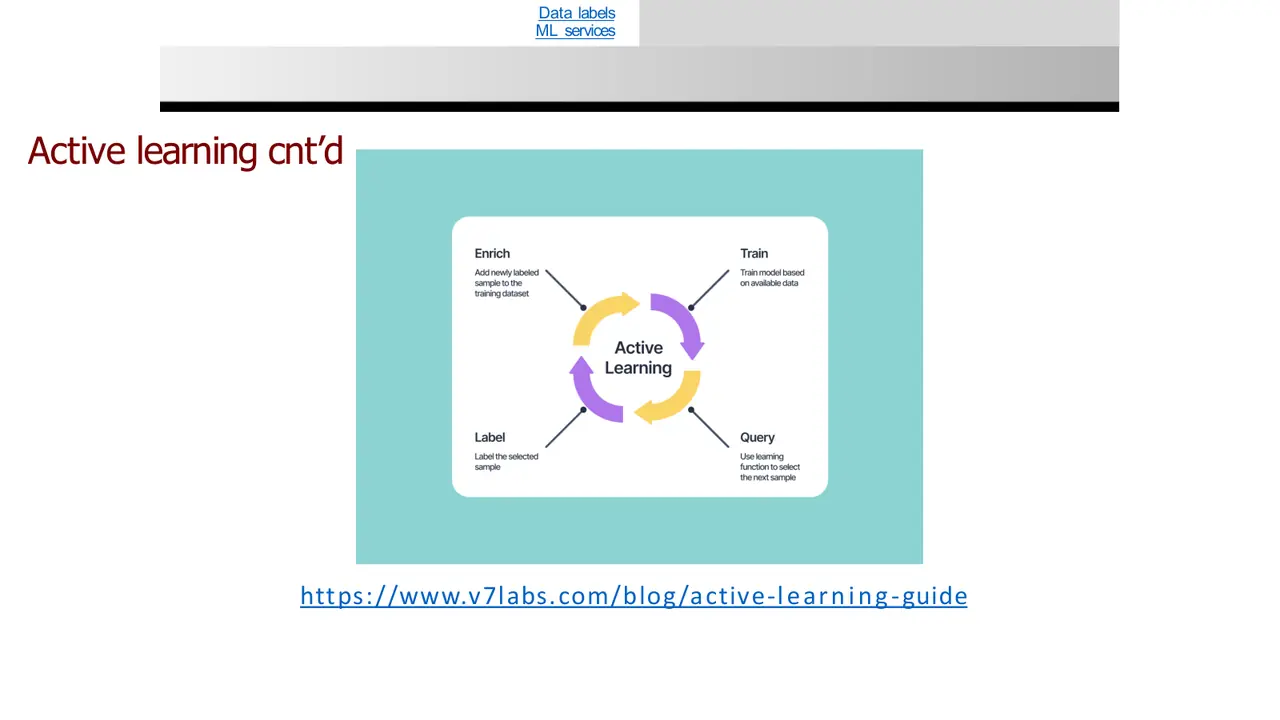
Active learning: label only the examples the model needs next
fig. 1 · Active learning: label only the examples the model needs next

What students hand in

Major assignments

  • Machine learning projects20%
  • Weekly Canvas quizzes20%
  • Class participation15%
  • Project proposal and update memos5%
  • Midpoint presentation5%
  • Final presentation and demo15%
  • Final report and code20%
fig. 2 · weight of each major assignment in the grade

Machine learning projects 20%

Guided technical projects done outside class, graded on a three-point scale. ML Project 1 builds the skeleton of a churn pipeline on AWS: data in S3, scoring in Lambda and SageMaker, predictions written to a MySQL database on RDS. ML Project 2 covers NLP and large language models. ML Project 3 forecasts daily peak demand and total energy for ten PJM power load areas with Prophet, writes forecasts and error metrics to RDS, and reads them in Streamlit or Tableau. An optional fourth project is the Tesla vs. Waymo case.

Weekly Canvas quizzes 20%

Ten questions on the prior week's lecture and lab, two attempts, no generative AI.

Class participation 15%

A short in-class quiz on most Mondays and a submitted lab notebook on most Wednesdays, graded for completion. The two lowest scores are dropped.

Project proposal and update memos 5%

A three-page proposal in week 2 naming the business question, a published ML solution to a similar problem, and a dataset, followed by two written progress memos: data and cloud set up by week 3, the full pipeline running by week 6.

Midpoint presentation 5%

A five-minute recorded team presentation of data, method, cloud setup, and first results. Each team gives written feedback to three other teams.

Final presentation and demo 15%

An eight-minute team presentation with a live walkthrough of the working system: model, cloud database of predictions, and dashboard.

Final report and code 20%

A 10 to 15 page report on the business problem, data, method, cloud architecture, results, and reflections, with a documented code repository. Teams of two to five rate each other's contribution.

In their words

What students say

4.63 out of 5 average teaching rating · 2 sections · 101 student responses · all evaluations

He showed many examples of how academic ideas connect to real work, and encourages hands-on tasks with real tools like AWS.

Spring 2026

Probably the most relevant class I took.

Spring 2026

Ben is my favorite professor of all time, please keep up the great work!

Spring 2026

Revision history

How the course developed

I redesigned this MS in Business Analytics course for Spring 2026 around one question: how a trained model becomes part of a working business system. Mondays are lecture and Wednesdays are lab. Students build pipelines on AWS, put the results in Tableau or Streamlit dashboards, and finish with a team project demo.

Offerings

  • Spring 2026

Enrolled students get the lab notebooks on Canvas.

I also teach versions of this material to company teams, using their own data. Custom education

Book a free 15-minute call →

All courses