Ben Collier, PhD Book a call →free, 15 minutes

Carnegie Mellon University in Qatar · 2012 to 2016 · Undergraduate

Empirical Research Methods

Ask a question about people, design a survey, collect the data, and test it with regression.

About 23 students

This course taught students to evaluate and run original research on human behavior. Each student picked a question about life in Qatar, wrote a proposal, completed human subjects training, went through IRB review, wrote and piloted a survey, and collected their own data. We covered measurement, scales, sampling, survey design, and experiments along the way, then spent the last weeks on analysis so that every final paper tested its main hypothesis with regression. The semester ended with three days of student research presentations.
  • Spring 2013
  • Mondays and Wednesdays
  • Course number 70-323
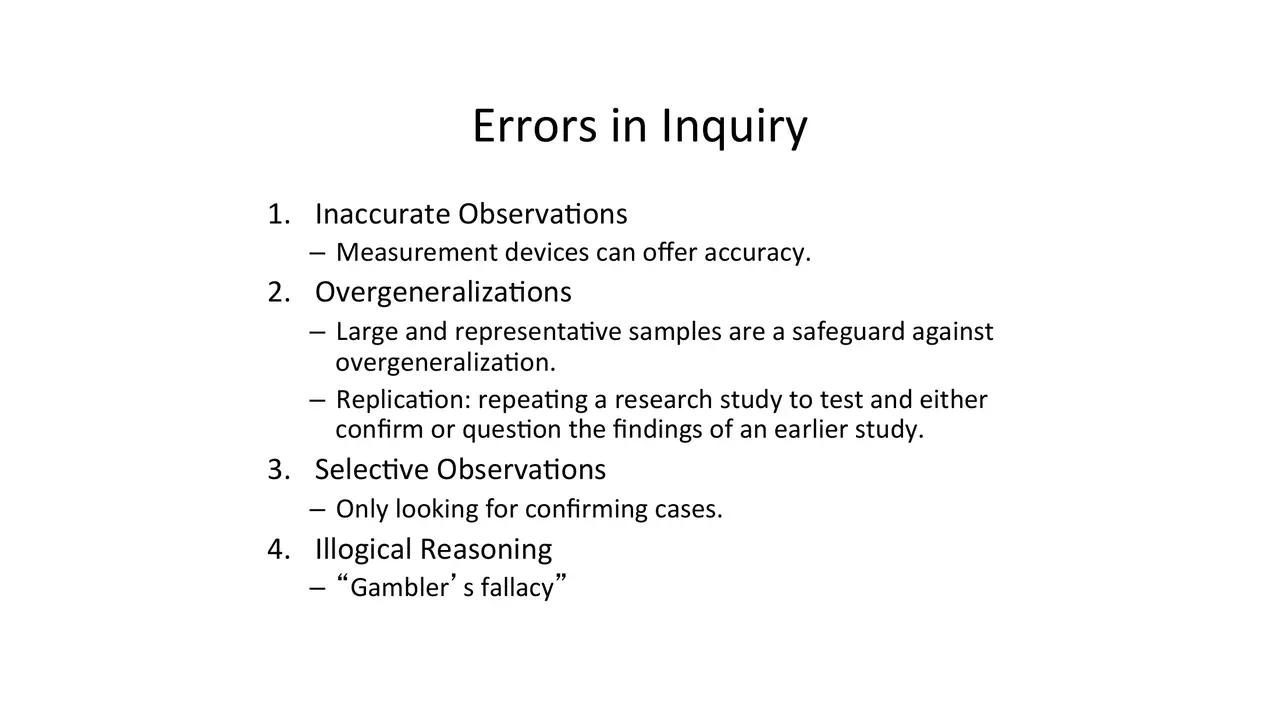
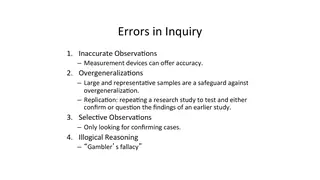
Slide: Errors in inquiry: inaccurate observation, overgeneralization, selective observation
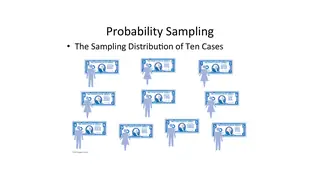
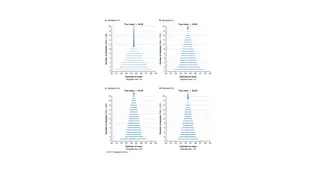
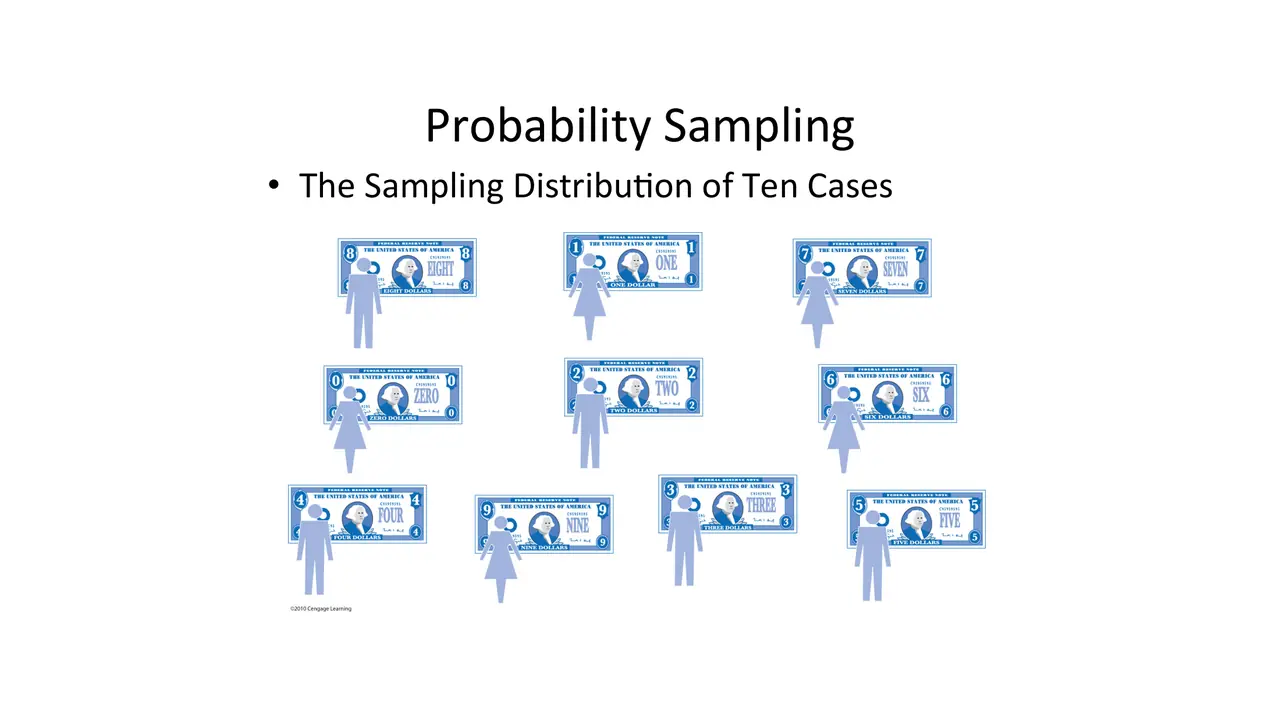
Slide: The sampling distribution of ten cases
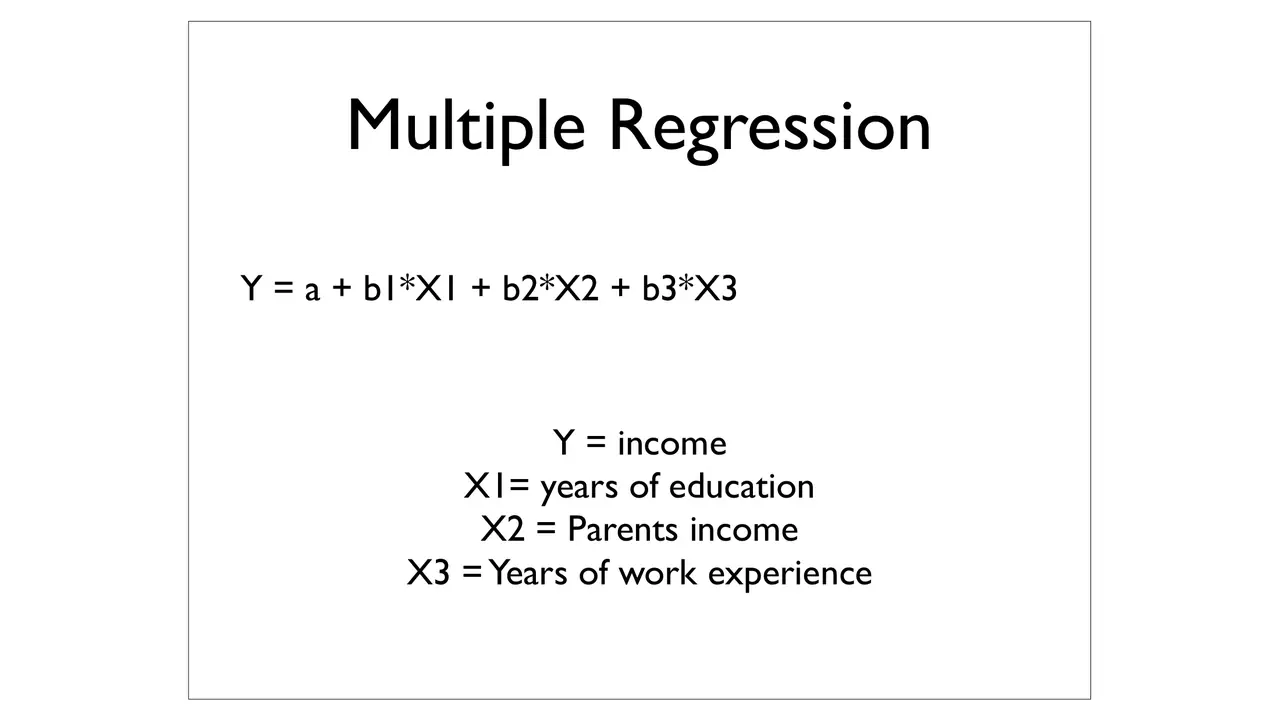
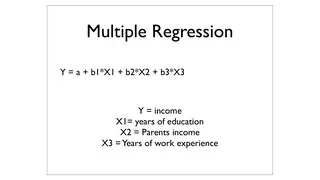
Slide: Multiple regression: income on education, parents' income, and experience

slides from the decks
I taught from

Spring 2013 · Mondays and Wednesdays

Week by week

Scroll the schedule and the slides follow along: five from each session, picked from the decks I taught from.
  1. Part I: Designing research
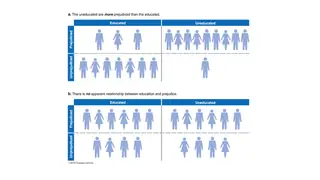
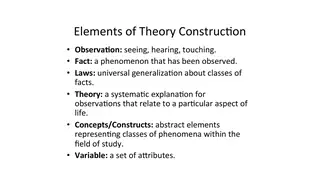
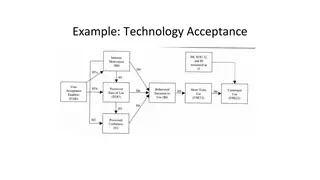
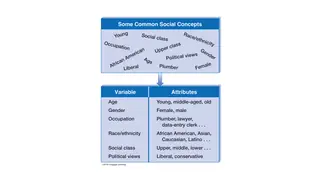
  2. W1Introduction to research designCovered January 14 and 16Errors in inquiry: inaccurate observation, overgeneralization, selective observationConcepts become variables, and variables have attributesWhat a relationship between education and prejudice looks like, and what no relationship looks likeThe elements of theory constructionA worked example: the technology acceptance model
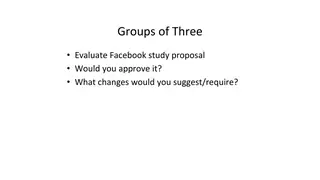
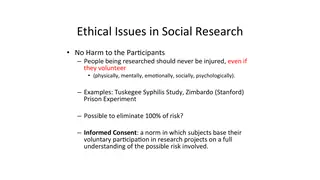
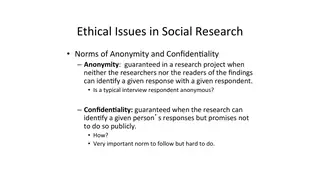
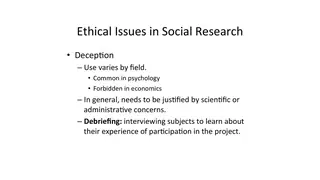
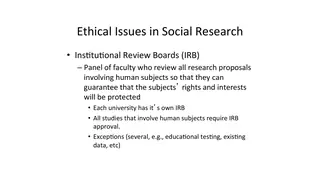
  3. W2Research ethicsGroups of three: would you approve this Facebook study?No harm to participants, and informed consentAnonymity versus confidentialityDeception, and debriefing afterwardInstitutional review boards
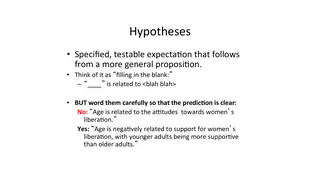
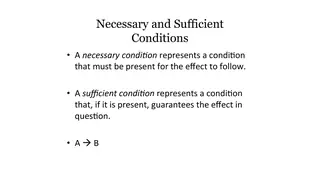
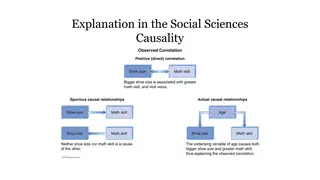
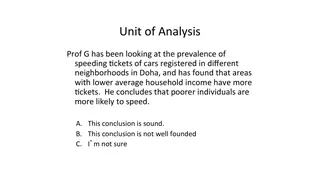
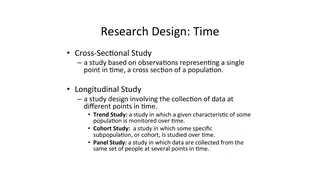
  4. W2Research designA good hypothesis says which way the relationship goesNecessary and sufficient conditionsCorrelation, spurious relationships, and real causesUnit of analysis: do more tickets in poorer Doha neighborhoods mean poorer drivers speed?Cross-sectional and longitudinal designs
  5. Part II: Measurement
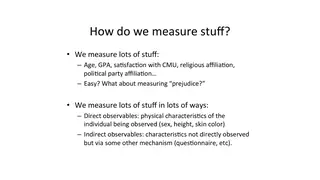
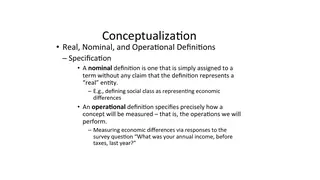
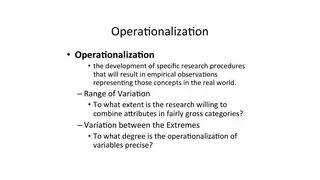
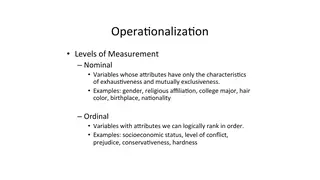
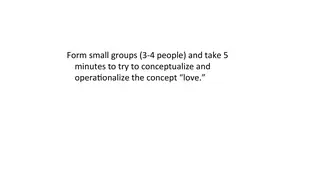
  6. W3Measurement: conceptualization and operationalizationHow do we measure things we cannot see?Conceptualization: nominal and operational definitionsOperationalization: range of variation and precisionLevels of measurementGroup exercise: conceptualize and operationalize 'love'
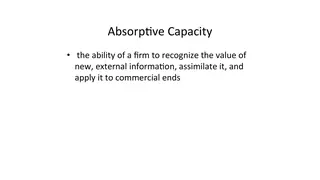
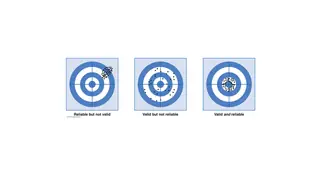
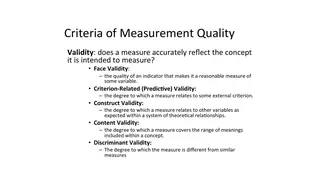
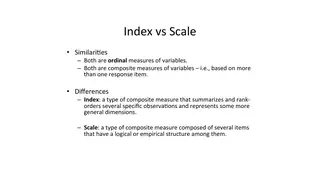
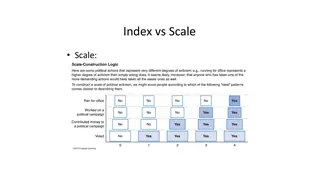
  7. W3Indexes and scalesAbsorptive capacity, a construct you cannot observe directlyReliable but not valid, valid but not reliable, bothThe kinds of validityIndex versus scaleHow a scale's items build on each other
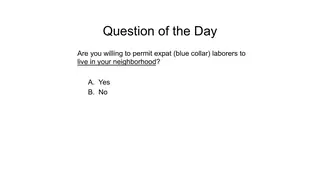
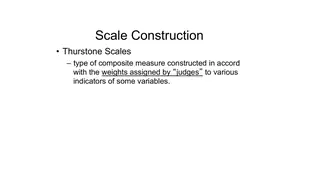
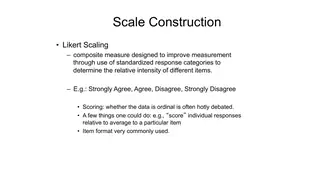
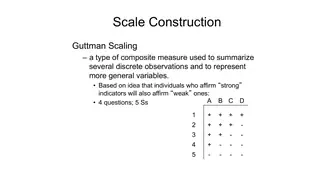
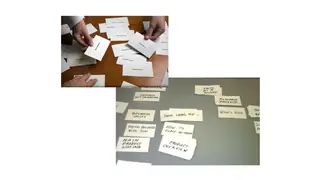
  8. W4Scale constructionSocial distance, one question at a timeThurstone scales: items weighted by judgesLikert scalesGuttman scales: agreeing with a strong item implies agreeing with weaker onesCard sorting to group items
  9. Part III: Sampling and surveys
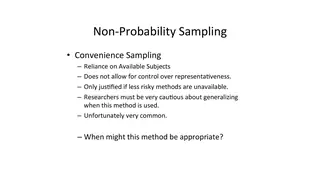
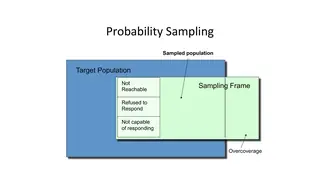
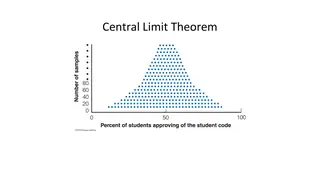
  10. W5SamplingExam 1 was on February 11Convenience sampling, and when it might be acceptableTarget population, sampling frame, and who you missThe sampling distribution of ten casesBigger samples give tighter sampling distributionsThe central limit theorem
  11. W6Sampling, part 2
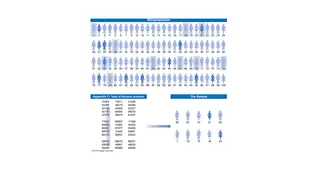
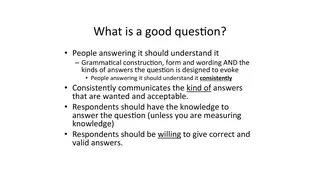
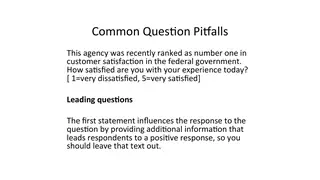
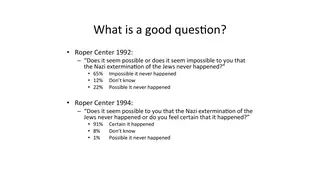
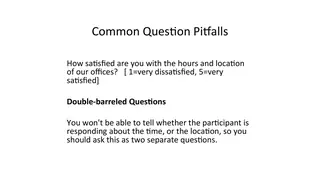
  12. W6Survey designIRB forms dueSimple random sampling from a numbered populationWhat makes a good survey questionA confusing double negative: 22% doubted the Holocaust in 1992, 1% with clearer wording in 1994Double-barreled questionsLeading questions
  13. W7Survey workshop: peer review of survey draftsIn-class exercise
  14. W8Spring breakNo class
  15. Part IV: Experiments
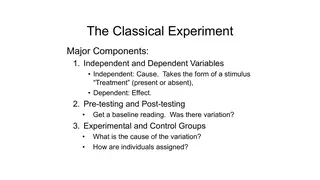
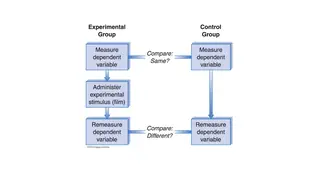
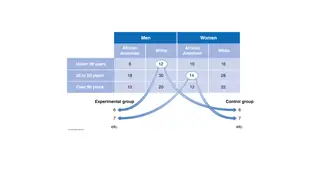
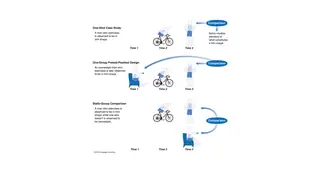
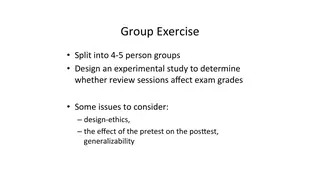
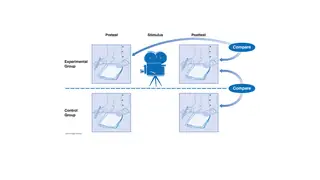
  16. W9Experimental designThe classical experimentExperimental and control groups, measured before and afterMatching subjects across groupsPre-experimental designs and what they leave outGroup exercise: design an experiment on whether review sessions raise exam grades
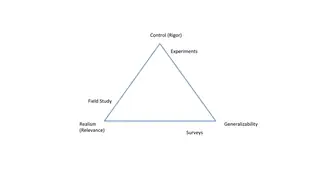
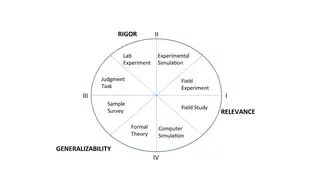
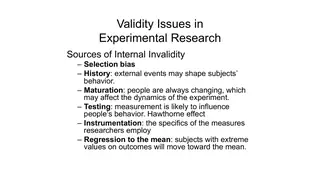
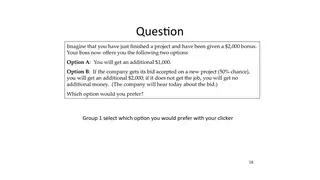
  17. W9Experiments, part 2: validity and settingsRigor, relevance, and generalizability: you can't maximize all threeWhere each research method sits between rigor and relevanceThreats to internal validityA pretest-posttest design with a control groupA framing experiment run on the class with clickers
  18. W10Evaluation research
  19. Part V: Analysis and presentation
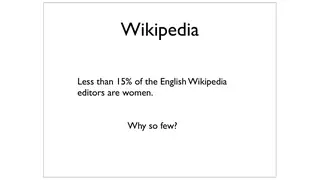
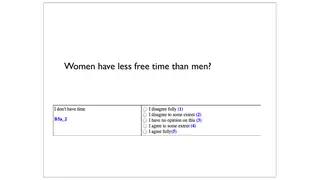
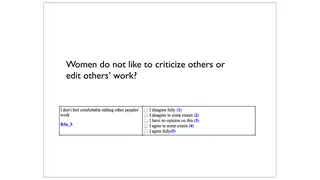
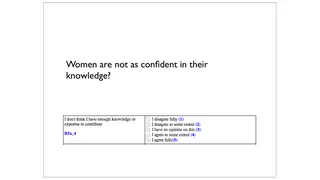
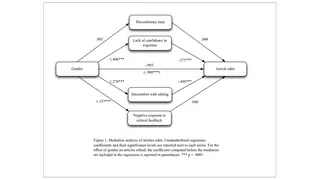
  20. W12Analysis: from survey items to a modelExam 2 was on April 1Less than 15% of English Wikipedia editors are women. Why so few?Turning a hypothesis into a survey item: free timeDiscomfort with criticizing or editing others' workConfidence in one's own knowledgeA mediation model of gender and editing
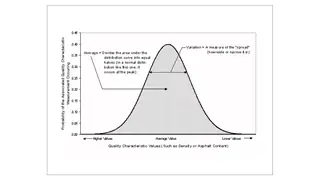
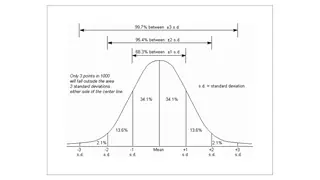
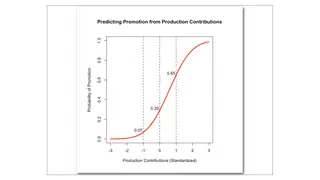
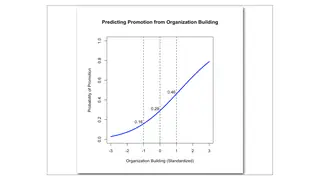
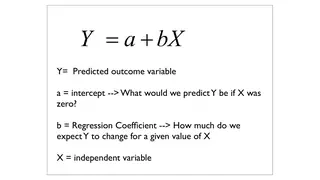
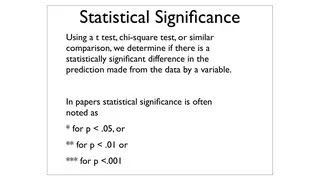
  21. W13Analysis: distributions and regressionThe normal distribution68, 95, and 99.7 percent within one, two, and three standard deviationsPredicting promotion from production contributionsPredicting promotion from organization buildingY = a + bX, term by term
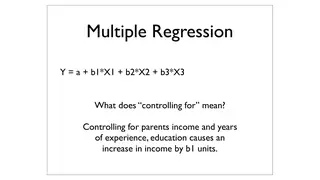
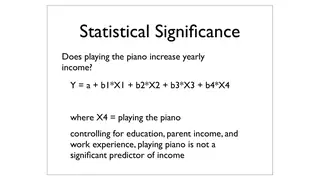
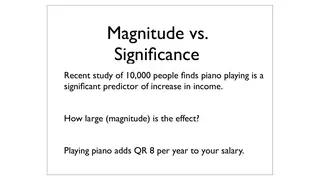
  22. W13Multiple regression and presenting researchMultiple regression: income on education, parents' income, and experienceWhat 'controlling for' meansDoes playing the piano raise your income?Reading the stars on a regression tableMagnitude versus significance: QR 8 a year is not much
  23. W14In-class analysis in ExcelIn-class exercise
  24. W14Student research presentationsPresentations

What students hand in

Major assignments

  • Final research report15%
  • Final presentation15%
  • Pilot studies and drafts10%
  • Two midterm exams40%
  • Online quizzes10%
  • Participation10%
fig. 1 · weight of each major assignment in the grade

Final research report 15%

A 2,000 to 2,500 word paper with introduction, literature review of at least three research articles, hypotheses, methods, results, and the survey as an appendix. Every paper had to test its main hypothesis with regression.

Final presentation 15%

A short talk on the study and its results, over three days at the end of the semester.

Pilot studies and drafts 10%

CITI human subjects training, two proposal drafts, IRB forms, and a survey draft that classmates took and critiqued in class before the final version went out.

Two midterm exams 40%

20% each, on research design and measurement, then sampling, surveys, and experiments.

Online quizzes 10%

Eight quizzes on the Babbie readings, lowest score dropped.

Participation 10%

Attendance by clicker, and in-class design exercises.

What students built

Student work

Every project, by term.
Spring 2013: student survey studies 22 projects
  • Student satisfaction in Education City versus Qatar University. Compared satisfaction at the private branch campuses and the national public university. Survey
  • School environment and the desire to study. Whether the school environment relates to students' motivation to keep studying. Survey
  • Employment expectations of CMU Qatar students. Whether nationality, family, and gender shape what students expect after graduation. Survey
  • First-year friendships. Whether first-year students befriend people who are academically similar or similar in other ways. Survey
  • Pedestrian safety in Qatar. Whether pedestrians feel safe on Doha's roads, and what urban planners could change. Survey
  • Mass media and body image. Effects of mass media on body image, eating habits, and exercise. Survey
  • Attitudes toward weight-loss surgery. Whether people accept surgical methods of losing weight over diet and exercise. Survey
  • Creativity. What relates to self-reported creativity among students. Survey
  • Online piracy by students in Qatar. Whether money and the lack of paid alternatives predict how much students pirate. Survey
  • Extracurricular activities and grades. Whether taking part in extracurricular activities affects academic performance. Survey
  • Eating habits on and off campus. Whether students living off campus eat more healthily than those in the dorms. Survey
  • Social capital and academic achievement. Whether relationships with friends and professors relate to grades. Survey
  • Music and aggression. Whether taste in music relates to aggressive attitudes. Survey
  • Buying a car in Qatar. Consumer views of the car market and dealers. Survey
  • Parental control and childhood obesity. Whether parents' control over eating and activity relates to obesity, given high overweight rates in Qatar. Survey
  • Motivation and academic performance. How student motivation relates to grades. Survey
  • Sports in university life. What keeps students from taking part in campus sports. Survey
  • Mobile phone use and academic productivity. Whether heavier phone use goes with lower academic performance. Survey
  • Social media in Qatar. How people in Qatar use social media. Survey
  • Internet use and happiness. Whether how often people use the internet relates to depression and happiness. Survey
  • Why people lie. Whether people with different characteristics tell different kinds of lies. Survey
  • Gender and computer literacy in Qatar. Whether men and women in Qatar differ in computer literacy. Survey

In their words

What students say

4.55 out of 5 average teaching rating · 1 section · 22 student responses · all evaluations

Very interesting course that will help me a lot, we learned a lot about research, how to conduct surveys and how to evaluate the data. The professor was supporting.

Spring 2013

He is very flexible and welcoming. He helped me a lot in coming up with a good research topic.

Spring 2013

Professor Ben is awesome! So kind and respectful.

Spring 2013

Offerings

When I taught it

  • Spring 2013

All courses