
Ben Collier, PhD Book a call →free, 15 minutes

Tepper · MS in Business Analytics Course
I built

MS in Business Analytics Math Skills Workshop

The math incoming MS in Business Analytics students need before the quantitative core begins.

A workshop I developed for incoming MS in Business Analytics students in Summer 2026. The goal is for students to start the program's quantitative courses with the mathematics already in place, so they are not learning it at the same time as the statistics.

  • Summer 2026
  • Self-paced online, on Canvas
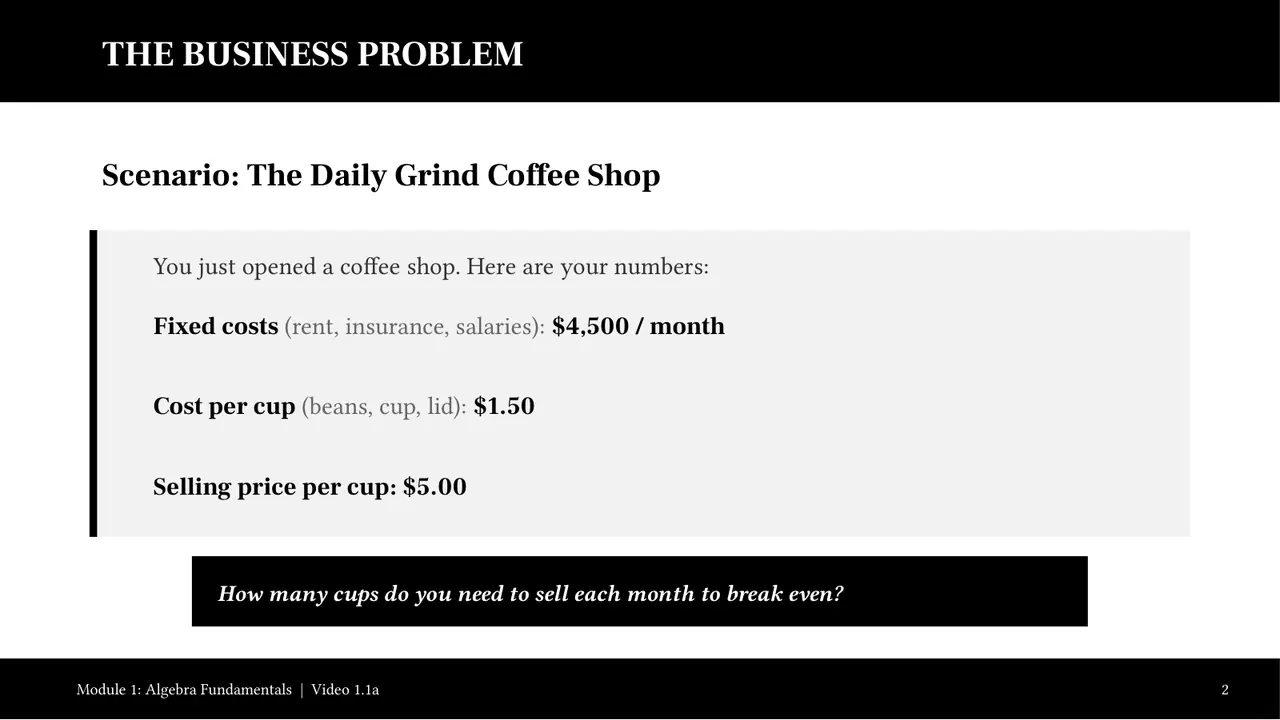
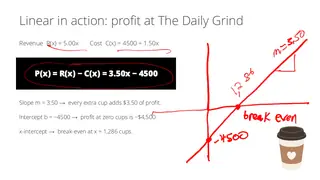
Slide: The Daily Grind: $4,500 a month in fixed costs and a $5 cup. When does it break even?
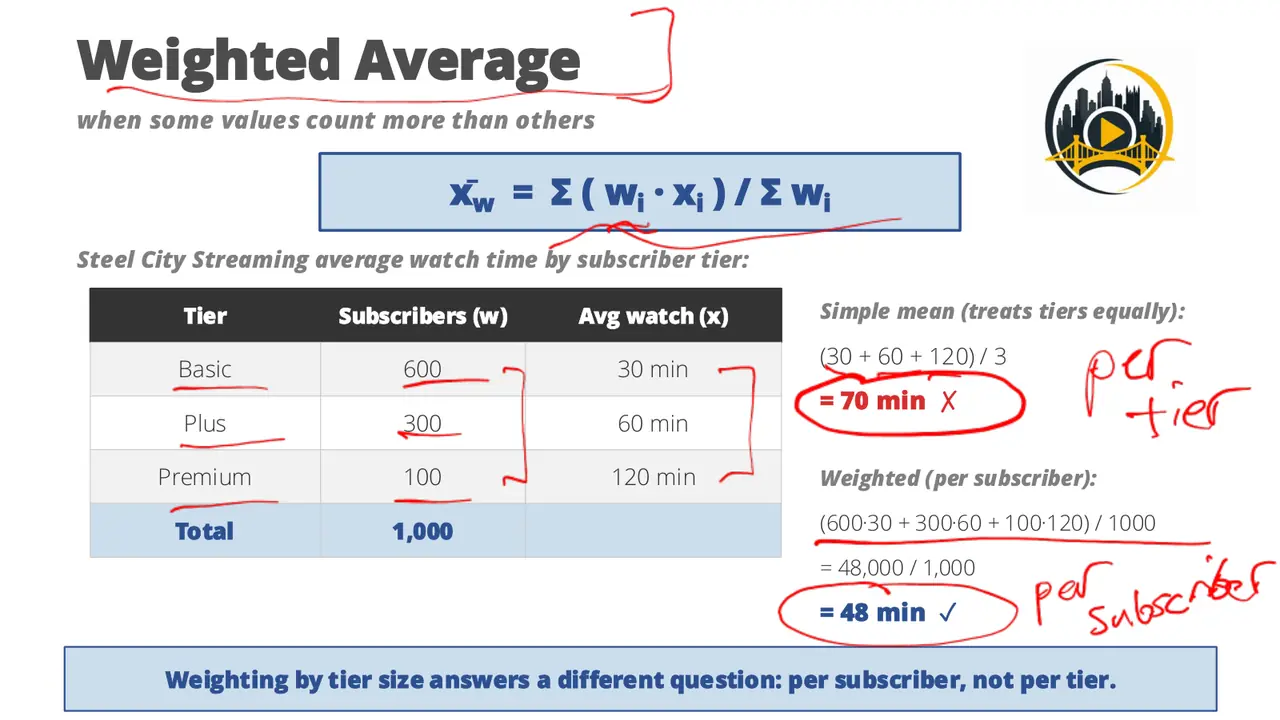
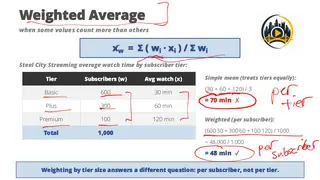
Slide: Weighted averages: watch time by subscriber tier
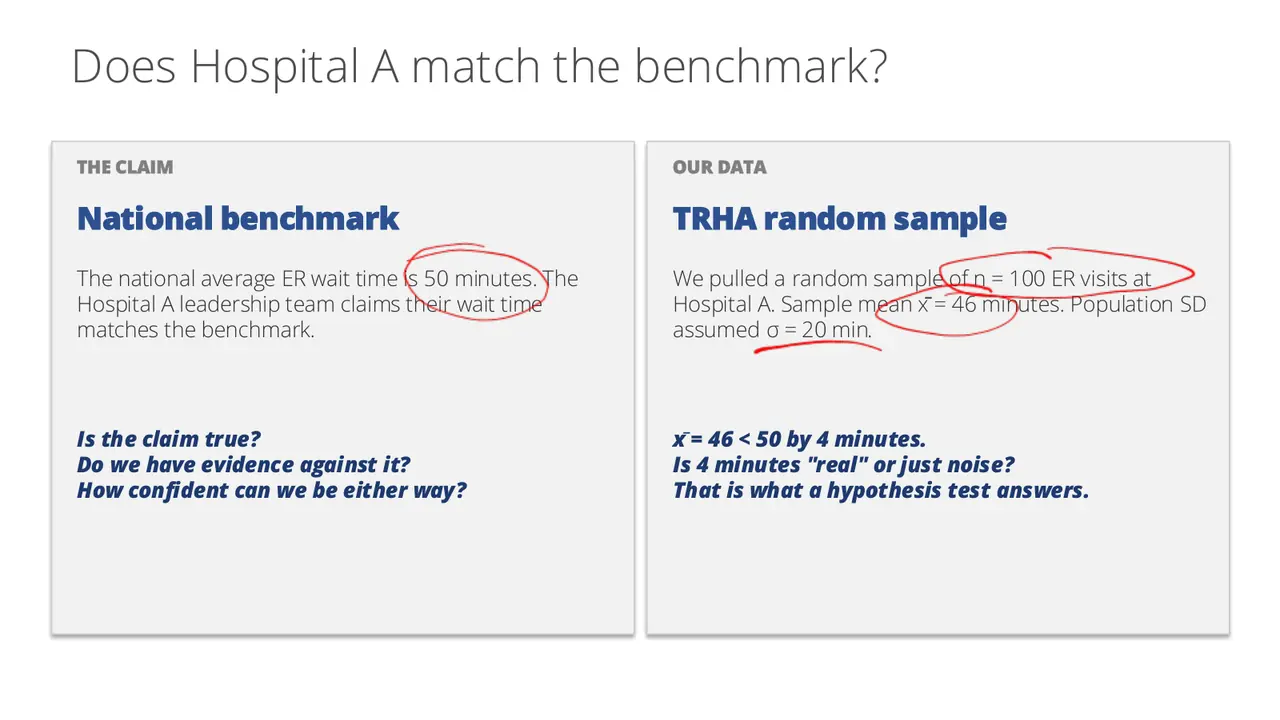
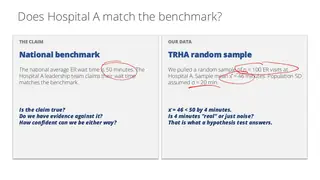
Slide: Does Hospital A match the 50-minute national benchmark?

slides from the decks
I taught from

Summer 2026 · Self-paced online, on Canvas

Week by week

Scroll the schedule and the slides follow along: five from each session, picked from the decks I taught from.

  1. Module 1: Algebra Fundamentals and Functions
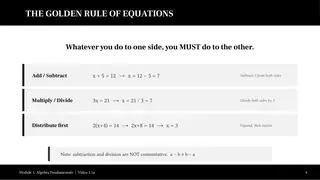
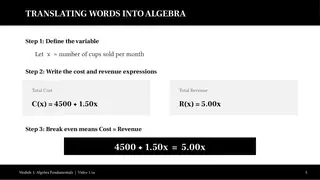
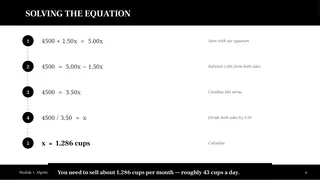
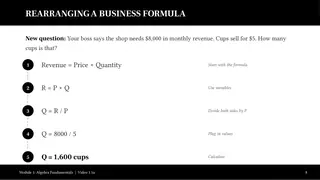
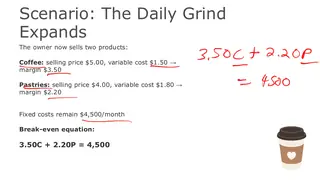
  2. M1Solving Linear Equations and Isolating VariablesRunning case: The Daily Grind, a coffee shopThe Daily Grind: $4,500 a month in fixed costs and a $5 cup. When does it break even?The golden rule: whatever you do to one side, do to the otherTranslating words into algebra: cost and revenue as functions of cups soldSolving 4,500 + 1.50x = 5.00x step by step: about 1,286 cups a monthRearranging Revenue = Price × Quantity to answer the boss's new question
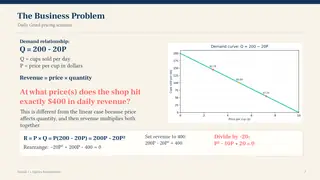
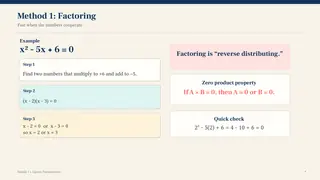
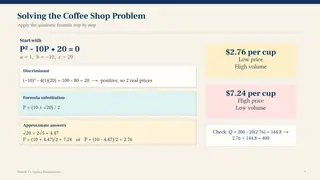
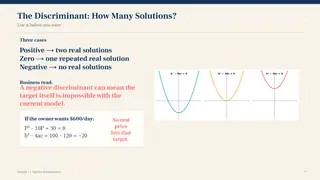
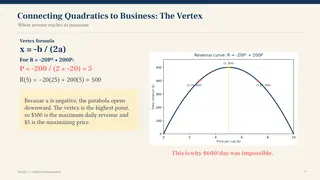
  3. M1Solving Quadratic EquationsDemand Q = 200 − 20P: at what price does the shop bring in $400 a day?Factoring, the fast method when the numbers cooperateThe quadratic formula gives two prices that produce the same revenueThe discriminant tells you how many solutions exist before you solveThe vertex of the revenue curve is the revenue-maximizing price
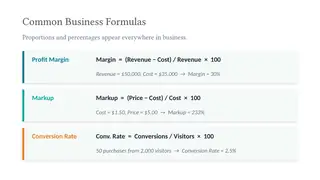
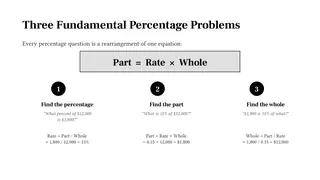
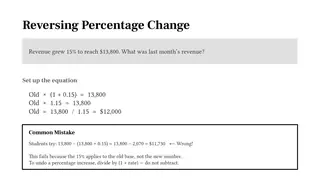
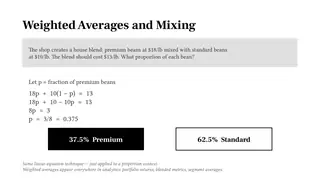
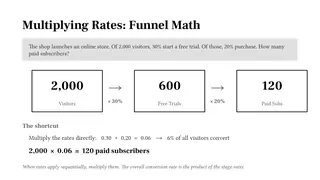
  4. M1Proportions and PercentagesProfit margin, markup, and conversion rate: three formulas students will use constantlyEvery percentage problem is a rearrangement of Part = Rate × WholeReversing a 15% increase means dividing by 1.15, not subtracting 15%Weighted averages: blending $18 and $10 beans to hit $13 a poundFunnel math: 2,000 visitors, 600 free trials, 120 paid subscribers
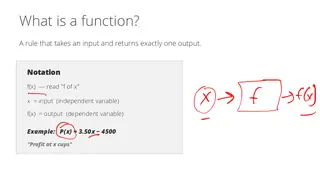
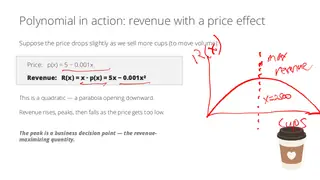
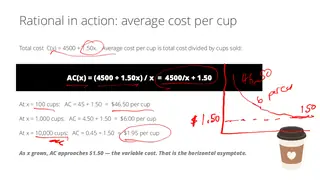
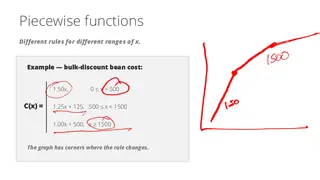
  5. M1Functions and GraphsA function is a machine: one input in, exactly one output outLinear in action: the shop's profit is P(x) = 3.50x − 4,500Polynomial in action: cut the price to sell more and revenue curves overAverage cost per cup falls toward $1.50 but never reaches itPiecewise functions: a bulk discount changes the rule past a threshold
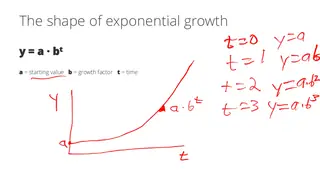
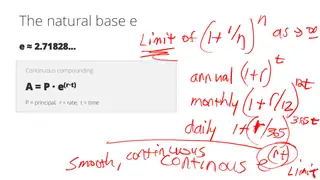
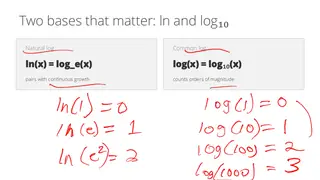
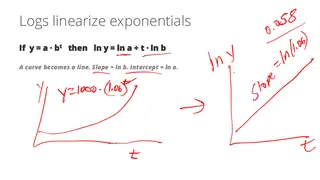
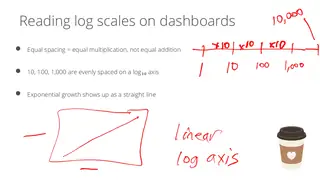
  6. M1Exponential and Logarithmic FunctionsExponential growth, y = a·bᵗ, sketched by handThe natural base e: what compounding becomes when it is continuousTwo logs that matter: ln for continuous growth, log₁₀ for orders of magnitudeLogs turn an exponential curve into a straight lineReading a log scale: equal spacing means equal multiplication
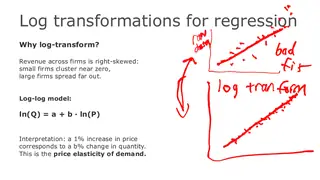
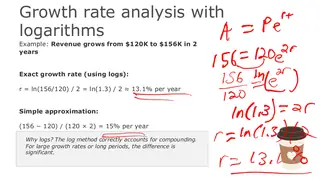
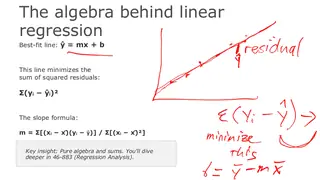
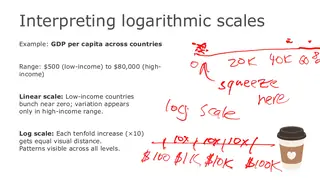
  7. M1Algebra in Action: Applications to AnalyticsMulti-product break-even: coffee and pastries in one equationWhy log-transform: in ln Q = a + b ln P, the slope b is the price elasticityGrowth rate from $120K to $156K in two years, using logarithmsThe algebra behind linear regression: slope and intercept from sumsLog scales let GDP per capita from $500 to $80,000 fit on one axis
  8. Module 2: Calculus Essentials for Analytics
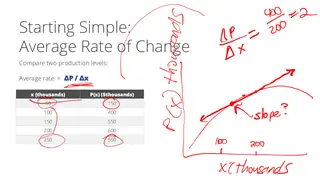
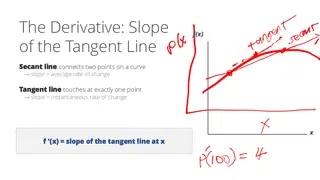
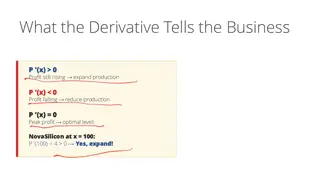
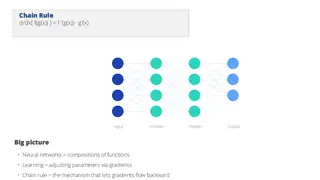
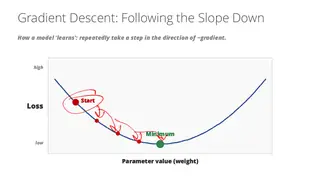
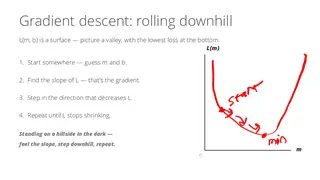
  9. M2Derivatives and Rates of ChangeRunning case: NovaSilicon, an AI chip makerAverage rate of change in profit between two production levelsThe derivative is the slope of the tangent lineWhat the derivative tells the business: expand, cut back, or stop at the peakThe chain rule is how a neural network passes gradients back through its layersGradient descent: follow the slope down to the lowest loss
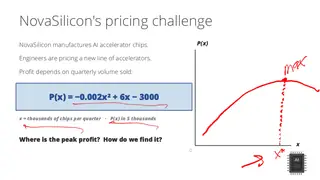
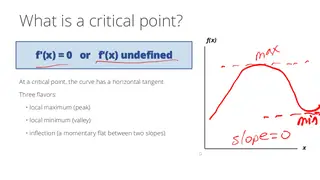
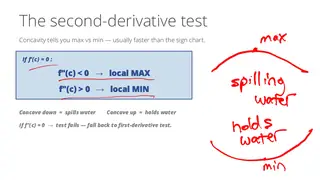
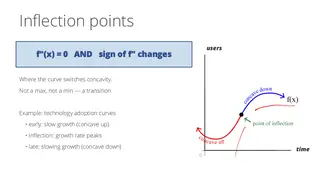
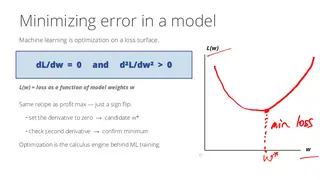
  10. M2Optimization and Critical PointsNovaSilicon's pricing challenge: where is the peak of the profit curve?A critical point is where the tangent goes flatThe second-derivative test: concave down spills water, concave up holds itInflection points on a technology adoption curveTraining a model is optimization: set dL/dw to zero and check the curvature
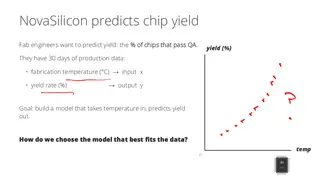
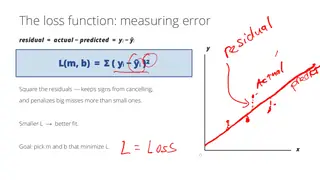
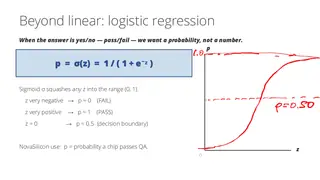
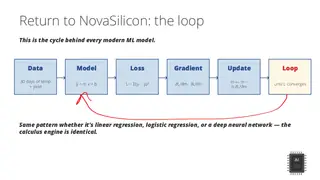
  11. M2Applications to Analytics ModelsPredicting chip yield from fabrication temperatureLoss as the sum of squared residualsGradient descent: rolling downhill on the loss surfaceLogistic regression: the sigmoid turns a score into a probabilityData, model, loss, gradient, update, repeat: the loop behind modern machine learning
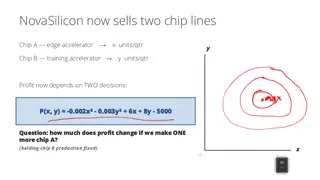
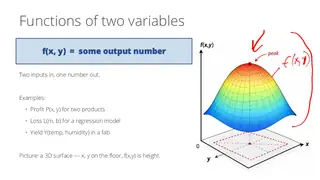
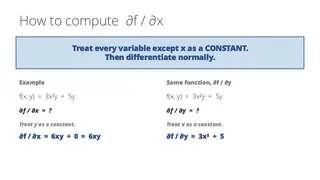
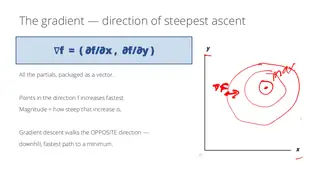
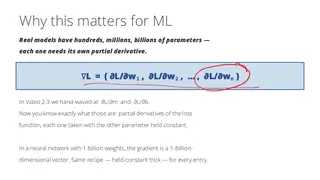
  12. M2Partial DerivativesNovaSilicon sells two chip lines, so profit now has two inputsA function of two variables is a surfaceTo take ∂f/∂x, treat every other variable as a constantThe gradient points uphill, in the direction of steepest ascentReal models have millions of parameters, each with its own partial derivative
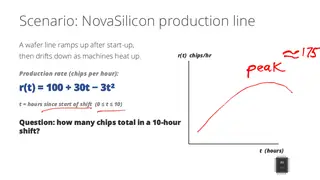
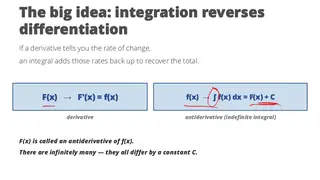
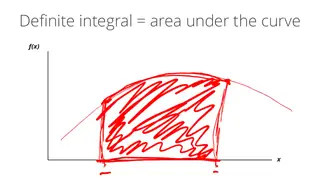
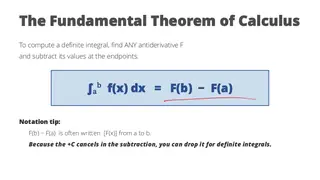
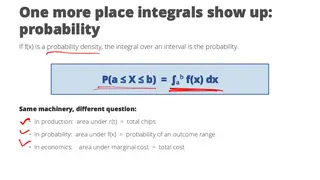
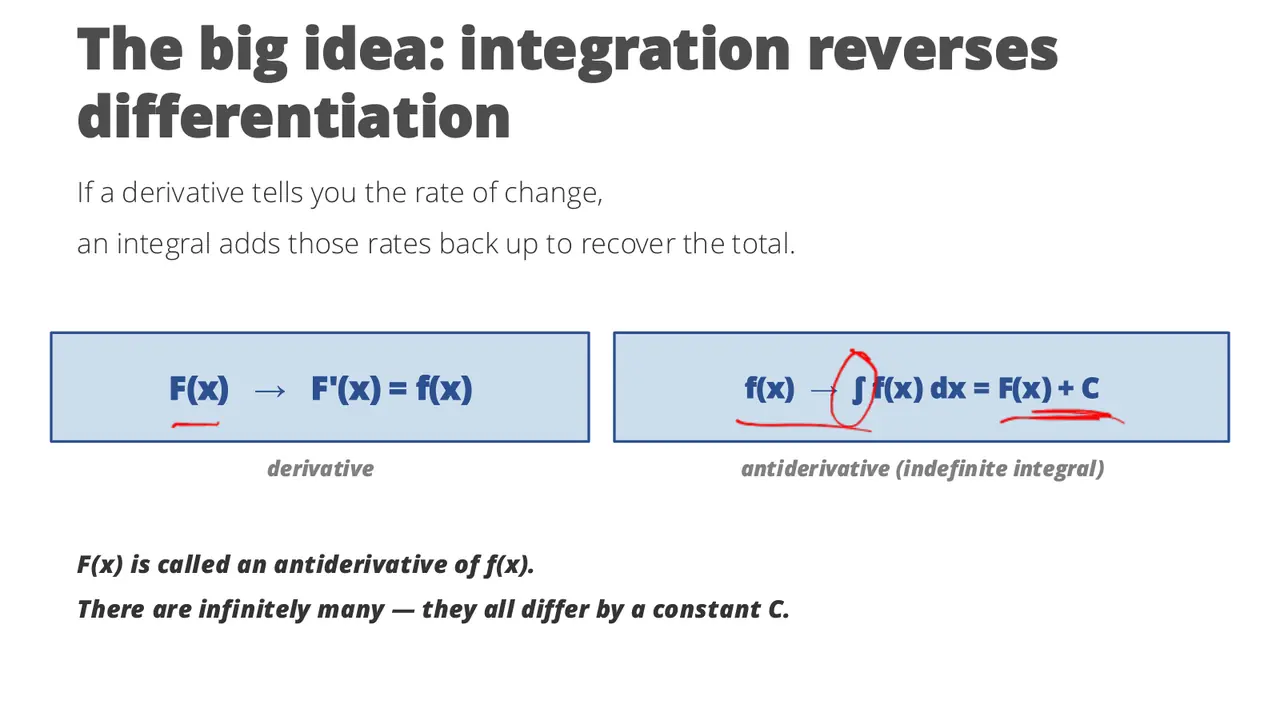
  13. M2Integration BasicsA wafer line ramps up, then drifts down: how many chips in a 10-hour shift?Integration reverses differentiationA definite integral is the area under the curveThe Fundamental Theorem of Calculus: F(b) − F(a)Same machinery, different question: probability as area under a density
  14. Module 3: Linear Algebra for Data Analytics
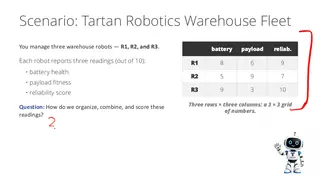
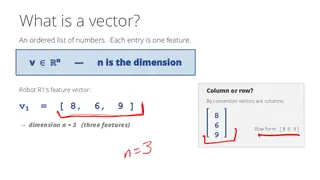
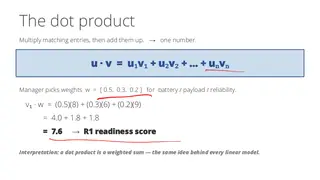
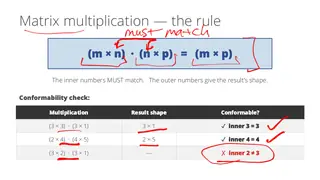
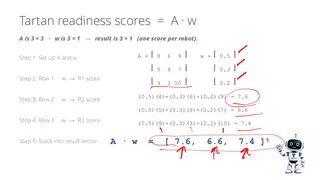
  15. M3Vector and Matrix BasicsRunning case: Tartan Robotics, a warehouse robot fleetTartan Robotics: three warehouse robots, three readings eachA vector is an ordered list of featuresThe dot product turns a robot's readings and a manager's weights into one scoreMatrix multiplication: the inner dimensions must matchReadiness scores for the whole fleet in one product, A·w
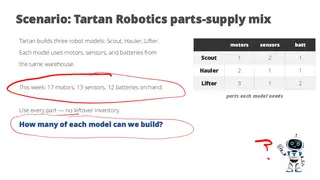
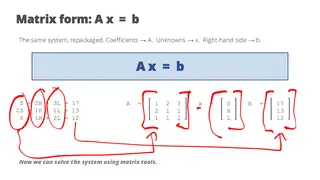
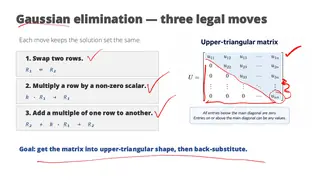
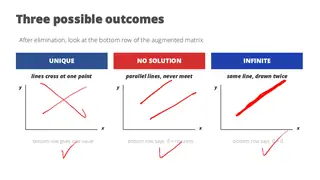
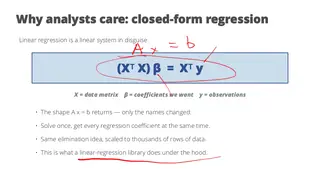
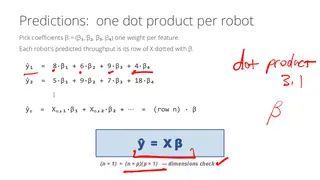
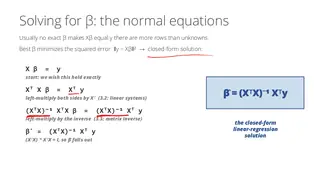
  16. M3Solving Linear SystemsHow many Scouts, Haulers, and Lifters can Tartan build from the parts on hand?The same system, repackaged as Ax = bGaussian elimination: three legal row movesUnique, none, or infinitely many: three ways a linear system can endLinear regression is a linear system in disguise: (XᵀX)β = Xᵀy
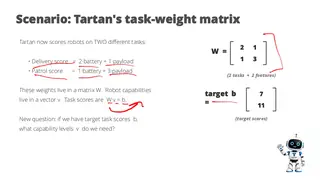
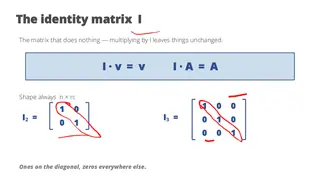
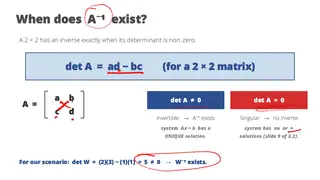
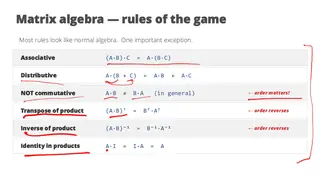
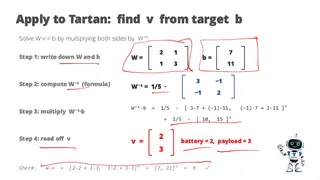
  17. M3Matrix Properties and TechniquesA task-weight matrix turns robot capabilities into task scoresThe identity matrix: multiplying by I changes nothingA 2×2 matrix has an inverse exactly when its determinant is not zeroMatrix algebra mostly follows the usual rules, except that AB ≠ BAWorking backward from target scores to capabilities with W⁻¹
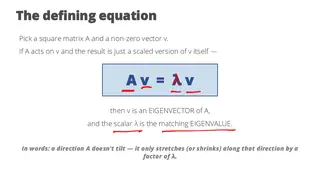
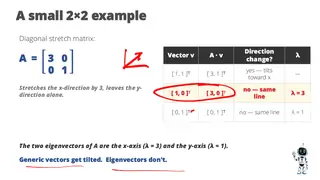
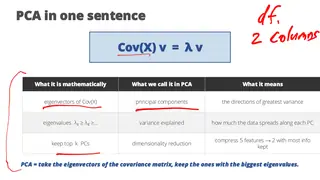
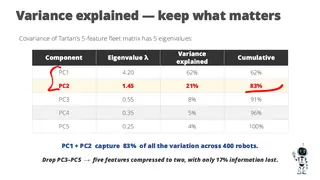
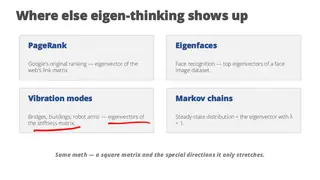
  18. M3Eigenvalues and EigenvectorsThe defining equation: Av = λvA stretch matrix tilts most vectors, but its eigenvectors only get longerPCA in one sentence: the eigenvectors of the covariance matrixTwo components capture 83% of the variation across 400 robotsWhere else eigen-thinking shows up: PageRank, eigenfaces, Markov chains
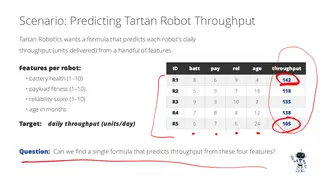
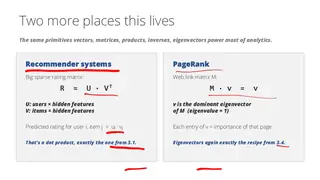
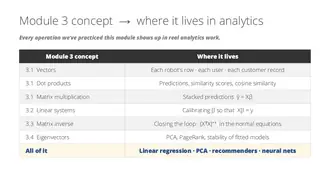
  19. M3Data Analytics ApplicationsPredicting each robot's daily throughput from its featuresEvery prediction is one dot product, so all of them together are ŷ = XβThe normal equations give the best-fitting β in closed formRecommender systems and PageRank run on the same matrix primitivesEvery Module 3 concept, mapped to where it lives in analytics
  20. Module 4: Descriptive Statistics and Data Visualization
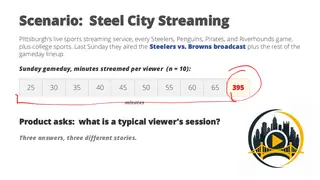
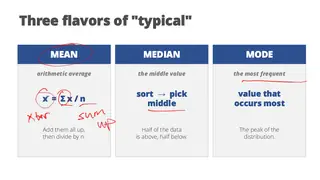
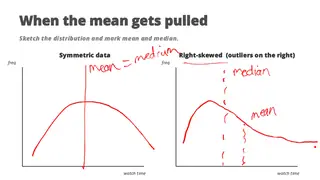
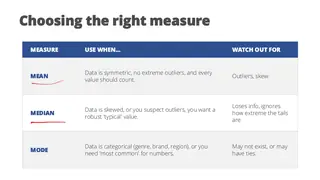
  21. M4Measures of Central TendencyRunning case: Steel City Streaming, a Pittsburgh sports streaming serviceSteel City Streaming: what is a typical session when one viewer watched 395 minutes?Three flavors of typical: mean, median, modeWeighted averages: watch time by subscriber tierSkewed data pulls the mean away from the medianChoosing the right measure, and what to watch out for with each
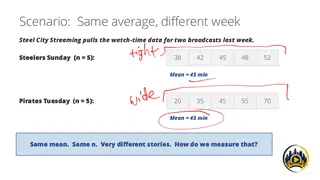
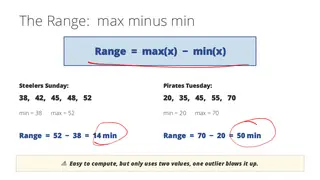
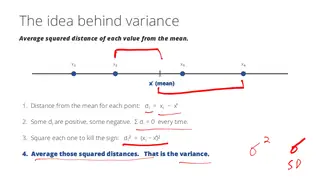
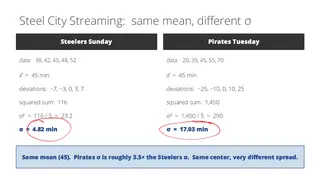
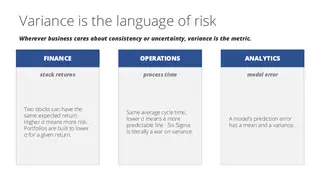
  22. M4Measures of DispersionSame average, different week: two broadcasts with very different spreadThe range is easy to compute, but one outlier blows it upVariance is the average squared distance from the meanSame 45-minute mean, very different standard deviationsVariance is the language of risk in finance, operations, and analytics
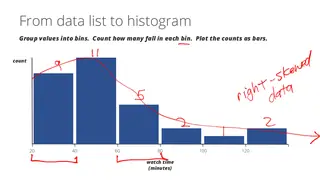
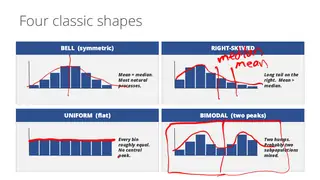
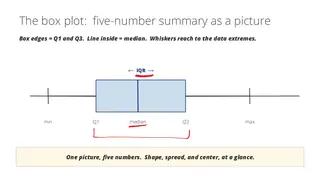
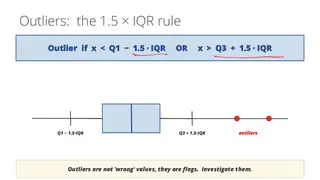
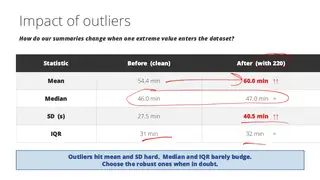
  23. M4Data Distribution and ShapeFrom a list of 30 watch times to a histogramFour classic shapes: bell, right-skewed, uniform, bimodalThe box plot: the five-number summary as a pictureFlagging outliers with the 1.5 × IQR ruleOne 220-minute session moves the mean and SD but barely touches the median and IQR
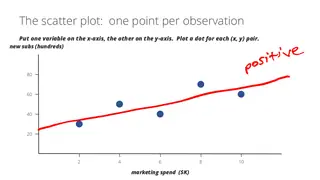
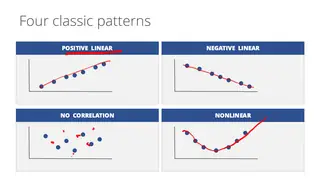
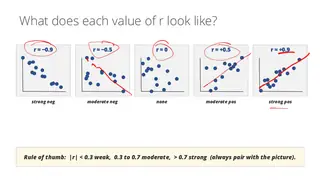
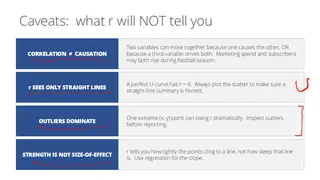
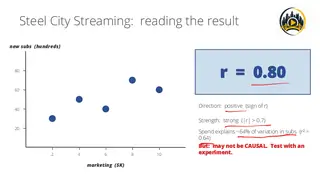
  24. M4Correlation and Scatter PlotsThe scatter plot: one point per week of marketing spendFour classic patterns: positive, negative, none, nonlinearWhat r of −0.9, −0.5, 0, 0.5, and 0.9 actually look likeWhat r will not tell you: causation, curves, outliers, effect sizeMarketing spend and new subscribers: r = 0.80
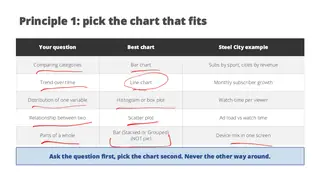
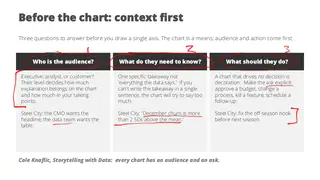
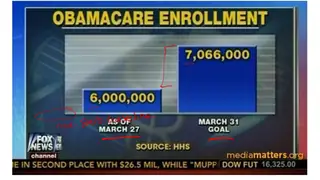
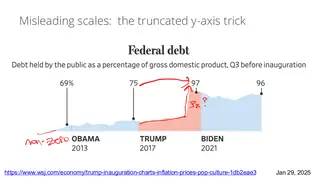
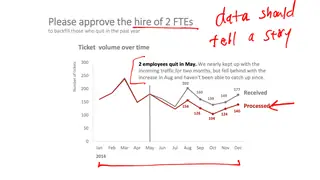
  25. M4Principles of Data VisualizationPick the chart that fits the question, never the other way aroundBefore the chart: who is the audience, what do they need to know, what should they doNo zero baseline, so 6 million enrollments look like a fraction of 7 millionThe truncated y-axis trick in a newspaper chart of federal debtData should tell a story: ticket volume rebuilt around one ask
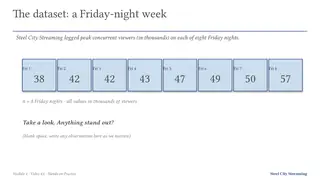
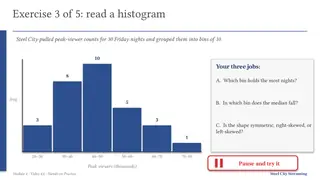
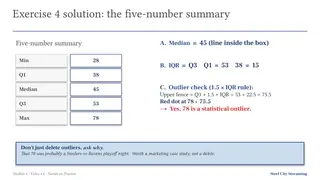
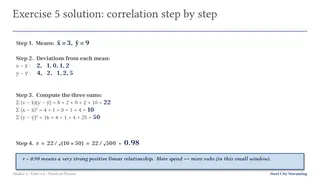
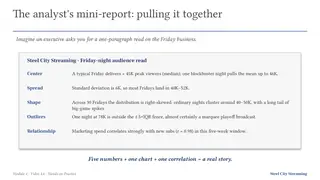
  26. M4Module 4 Hands-on PracticeIn-class exerciseFive exercises on one week of Steel City dataThe dataset: peak concurrent viewers on eight Friday nightsReading a histogram of 30 Friday nightsThe five-number summary read off a box plot, with an outlier checkCorrelation step by step, from deviations to rThe analyst's mini-report: the numbers turned into a short read for an executive
  27. Module 5: Probability Foundations and Random Variables
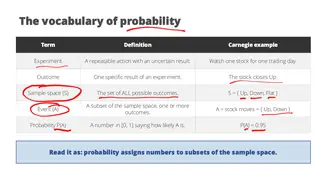
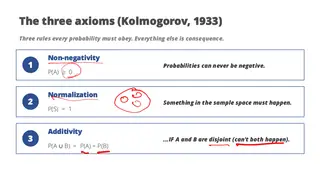
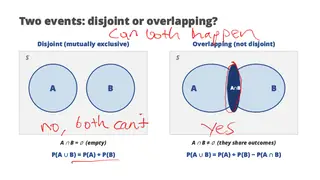
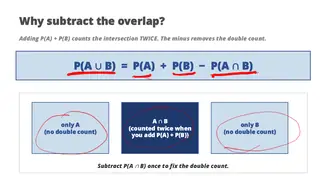
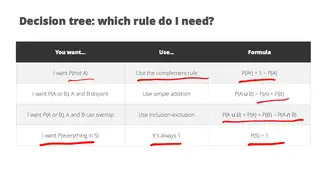
  28. M5Probability ConceptsRunning case: Carnegie Quant Capital, a fictional Pittsburgh hedge fundThe vocabulary of probability, using one stock's daily moveKolmogorov's three axioms: everything else is consequenceDisjoint or overlapping: can both events happen at once?Why subtract the overlap: P(A) + P(B) counts the intersection twiceA decision tree for which probability rule you need
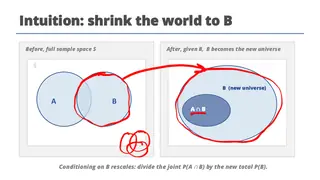
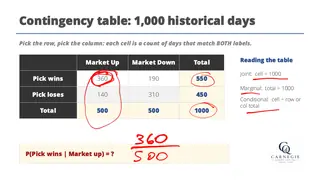
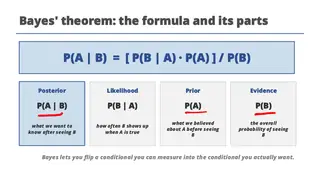
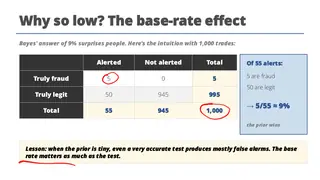
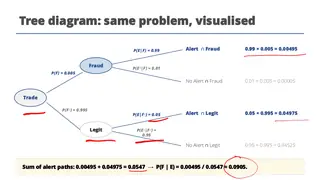
  29. M5Conditional Probability and Bayes' TheoremConditioning on B shrinks the world to BA contingency table of 1,000 historical trading daysBayes' theorem: posterior, likelihood, prior, evidenceA fraud alert that catches 99% of fraud is right only 9% of the time at a 0.5% base rateThe same fraud problem as a tree diagram
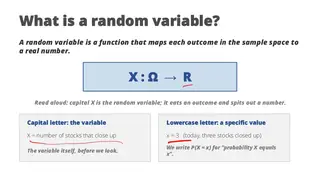
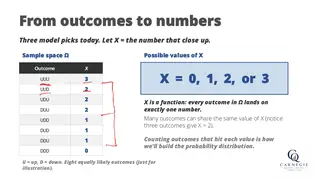
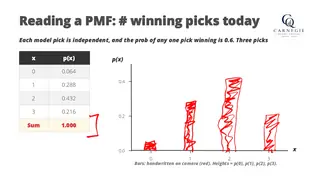
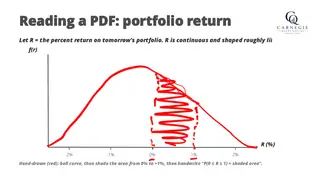
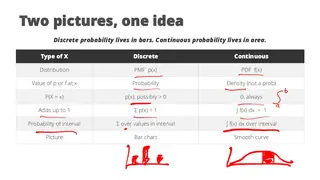
  30. M5Random VariablesA random variable is a function from outcomes to numbersThree picks, eight outcomes, and X = 0, 1, 2, or 3 winnersReading a PMF: the number of winning picks out of threeReading a PDF: probability as area under the portfolio return curveTwo pictures, one idea: discrete probability lives in bars, continuous in area
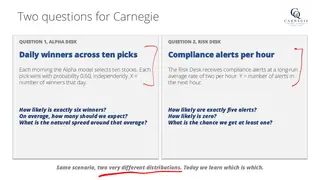
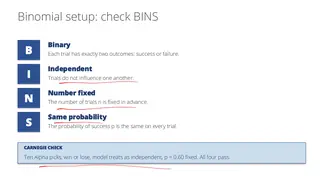
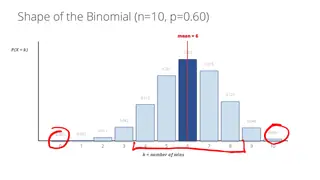
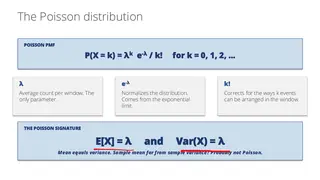
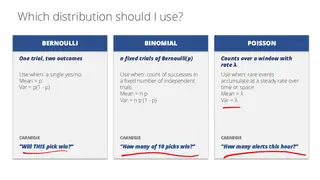
  31. M5Key Discrete DistributionsTwo questions: winners across ten picks, and compliance alerts per hourCheck BINS before you reach for the binomialThe shape of the binomial with n = 10 and p = 0.6The Poisson distribution, where the mean and the variance are both λBernoulli, binomial, or Poisson: which one to use
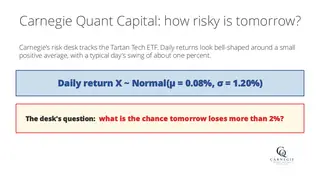
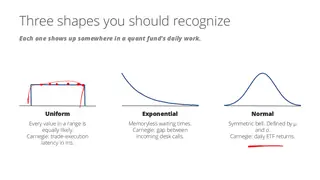
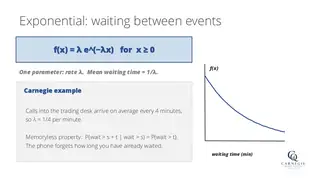
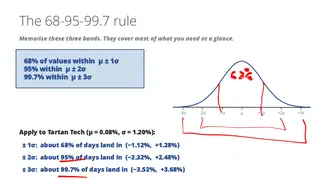
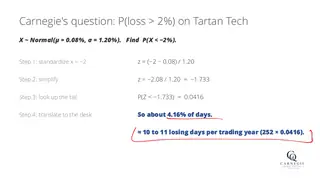
  32. M5Key Continuous DistributionsHow likely is tomorrow to lose more than 2%?Uniform, exponential, and normal: three shapes to recognizeThe exponential distribution: waiting time between eventsThe 68-95-99.7 rule applied to daily ETF returnsA z-score turns a 2% loss into about 10 losing days a trading year
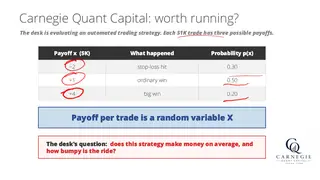
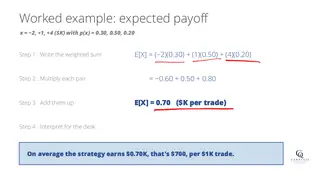
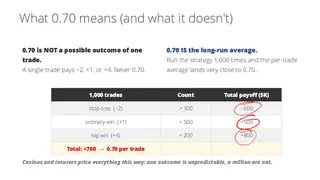
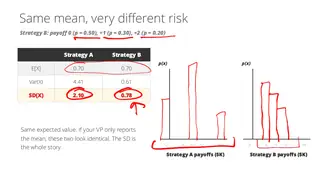
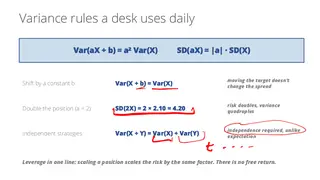
  33. M5Expectation and VarianceIs the strategy worth running? Payoff per trade is a random variableExpected payoff: $0.70K per tradeWhat 0.70 means: never the outcome of one trade, always the long-run averageSame mean, very different riskVariance rules a trading desk uses daily
  34. Module 6: Introduction to Statistical Inference
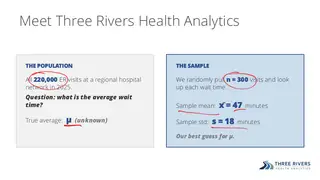
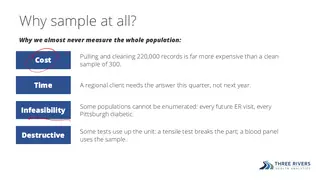
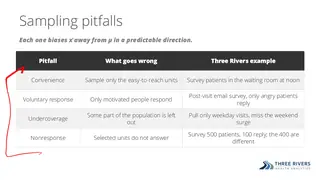
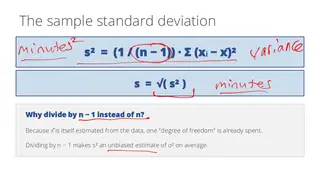
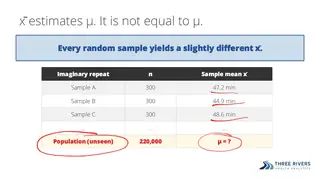
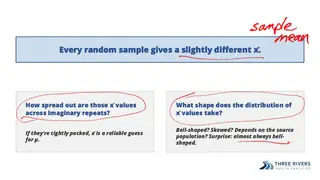
  35. M6From Sample to PopulationRunning case: Three Rivers Health Analytics, ER wait timesThree Rivers Health: 220,000 ER visits, and a sample of 300Why sample at all: cost, time, infeasibility, destructionSampling pitfalls, and the direction each one biases the estimateThe sample standard deviation, and why we divide by n − 1Every random sample yields a slightly different x̄
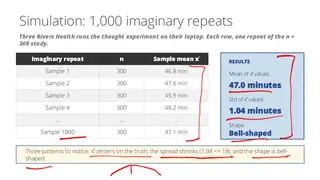
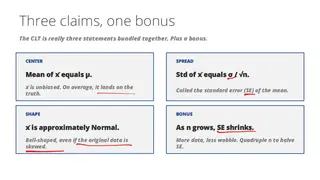
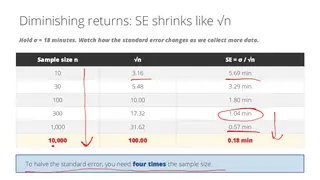
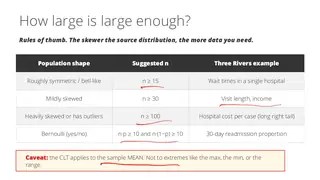
  36. M6Sampling Distributions and the Central Limit TheoremHow spread out are the sample means across imaginary repeats?Simulating 1,000 repeats of the ER studyThe Central Limit Theorem as three claims and a bonusDiminishing returns: to halve the standard error, quadruple the sampleHow large is large enough depends on how skewed the population is
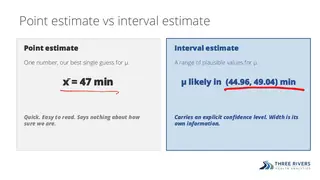
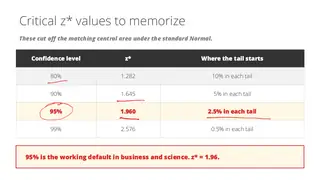
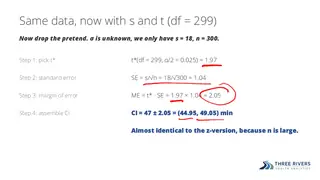
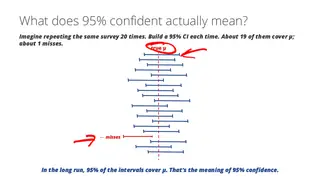
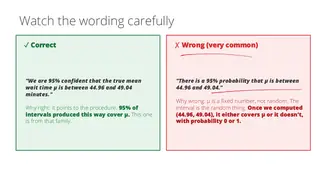
  37. M6Confidence IntervalsPoint estimate versus interval estimate: 47 minutes, or 44.96 to 49.04Critical z* values worth memorizingWith s and t instead of σ and z, the interval barely moves at n = 300What 95% confident means: about 19 of 20 intervals cover the true meanWatch the wording: the 95% describes the procedure, not μ
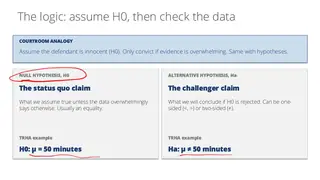
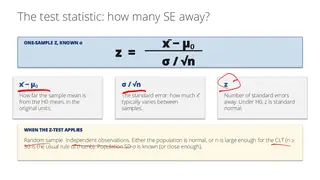
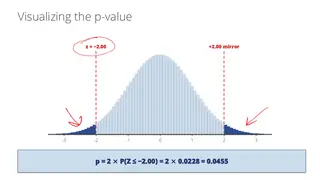
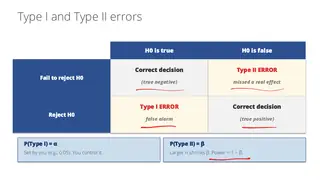
  38. M6Hypothesis TestingDoes Hospital A match the 50-minute national benchmark?Courtroom logic: assume H₀ until the evidence is overwhelmingThe test statistic counts how many standard errors the sample sits from H₀Visualizing a two-sided p-value of 0.0455Type I and Type II errors

Method

How the course works

Each module ends where an analytics course picks up. Calculus ends with gradient descent and the sigmoid. Linear algebra ends with the normal equations, PCA, and PageRank. Probability works through a fraud alert that is 99% sensitive and still right only 9% of the time at a 0.5% base rate.

I wrote the scope and sequence with the MS in Business Analytics core faculty, working backward from what their courses need. Before recording, I checked every equation symbolically.

Integration reverses differentiation
fig. 1 · Integration reverses differentiation

What students hand in

Major assignments

Pause-and-try problems

Every lesson stops at least once for a problem set in the running case, such as a new break-even point for the coffee shop or the standard error for a smaller hospital sample. Students pause, work it on paper, then watch the solution worked out by hand.

Module 4 hands-on practice

A full lesson of five exercises on one week of Steel City Streaming data: center, spread, a histogram, a box plot, and a correlation, ending with a one-paragraph analyst's report for an executive.

Diagnostic pretest, module quizzes, and posttest

The workshop is designed to open with a diagnostic pretest that shows each student which topics need the most work, give a short low-stakes quiz with immediate feedback at the end of each module, and close with a comprehensive posttest.

Revision history

How the course developed

A self-paced online course for incoming MS in Business Analytics students, built with Tepper's learning technologies team between December 2025 and August 2026. I recorded every lesson, about thirty short videos across six modules, each pairing slides with worked problems written out by hand.

Offerings

  • Summer 2026

Incoming MS in Business Analytics students take the workshop on Canvas.

All courses